
In addition to precious metals market updates and reports, I regularly share valuable tips and tricks that I find extremely helpful in my own market analyses and in the ones I share in this newsletter. I do this to ensure that all of my readers are on the same page and have the literacy needed to understand my analyses.
In today’s lesson, I am going to teach a simple yet powerful technique for identifying trends and looking past day-to-day noise and volatility in assets and markets, including but not limited to precious metals.
I was motivated to write this guide by the recent choppy behavior in precious metals caused by speculation about potential tariffs on U.S. gold imports. While this has created confusion, I have been consistent in telling everyone not to worry about the noise and to focus on the big-picture trend, which is highly bullish. So let’s dive in.
The tool I am teaching about today is the 200-day simple moving average (or 200-day MA for short). It is widely followed for identifying support and resistance levels, which is indeed useful. However, the unique way I use it is far less common and is even more valuable and powerful, in my opinion.
As a refresher for those unfamiliar, the 200-day simple moving average is calculated by averaging the last 200 days of closing prices of an asset. Each time a new data point is added, the oldest one is removed from the calculation, keeping the average focused on the most recent 200 days. This creates a rolling effect, allowing the moving average to track an asset’s price over time with a lag. It is useful for smoothing out noise and day-to-day volatility, making it easier to isolate the underlying trend.
The way I use the 200-day MA is by identifying its slope to determine whether the underlying trend is up, down, or sideways. In that sense, it is similar to the concept of a first derivative in calculus.

I consider myself a trend-following trader, and many of the greatest traders and investors of all time share that approach (learn more). Our mantras are “trade with the trend, not against it” and “the trend is your friend.” A trending asset is like a supertanker that needs two miles to turn around due to its strong momentum. There is a much greater chance of it continuing in the direction of the trend rather than reversing, so it is best to go with the grain instead of against it.
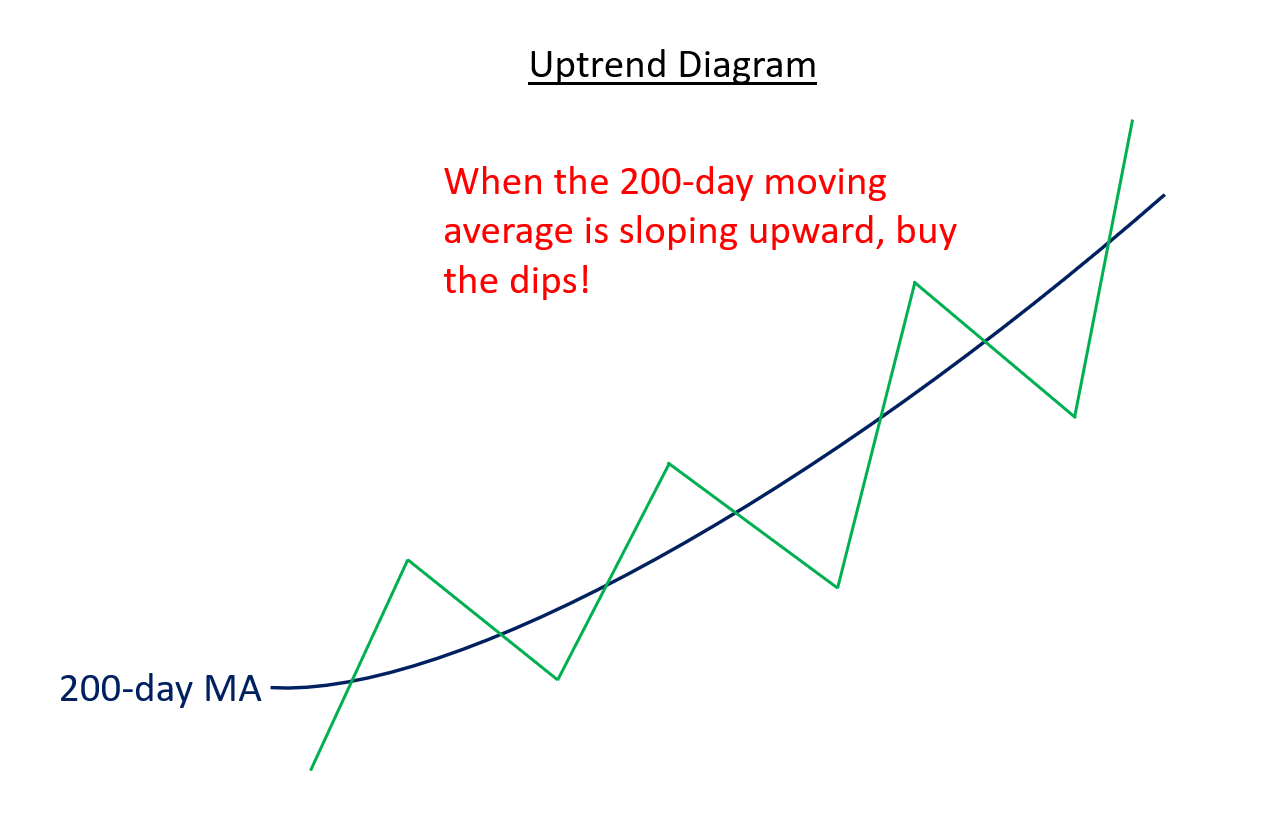
Next, let’s look at a series of diagrams that illustrate how I use the 200-day MA to determine an asset’s trend and establish my trading bias.
In the first diagram, we see an asset with a 200-day MA sloping upward, indicating a confirmed uptrend. In this scenario, I want to take only a bullish approach and avoid focusing on negativity, even when there are occasional down days. In a confirmed uptrend, this is when you want to “buy the dips,” as there is a high likelihood the asset will rebound and continue in the direction of the primary trend, which is up. Contrary to popular belief, buying the dips is not always a good strategy in all market conditions, as I will soon show—but it is effective when the trend is up.
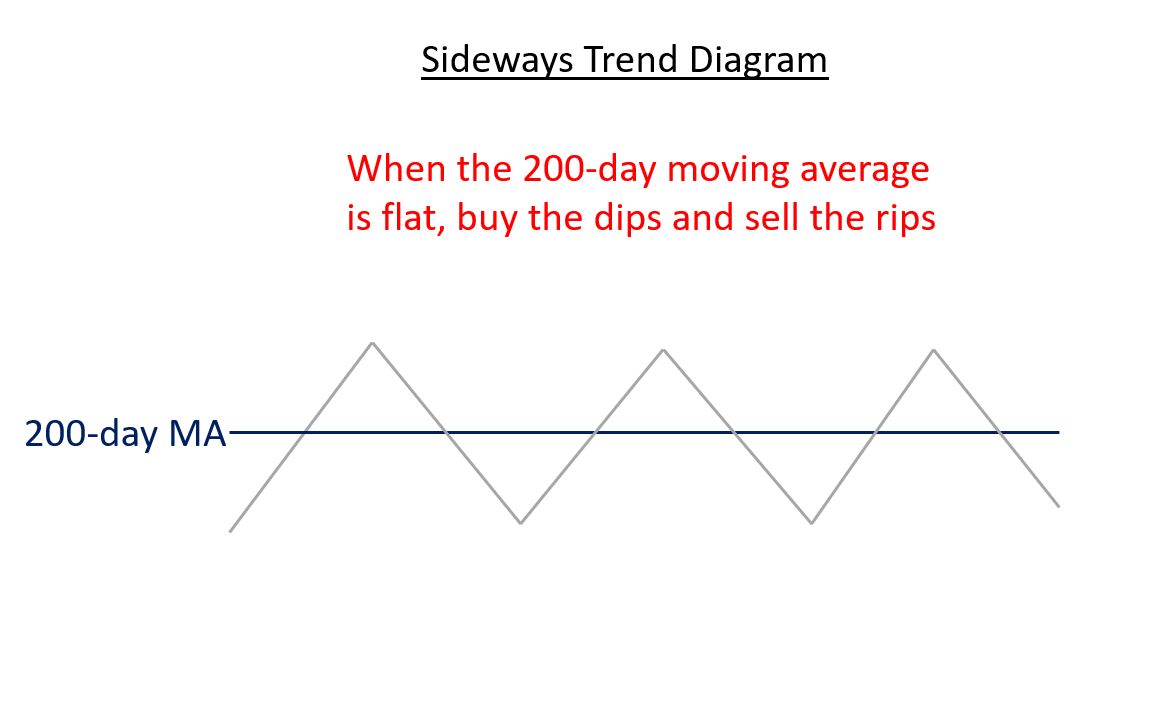
The next diagram shows a sideways trend, indicated by a 200-day MA with little to no slope. This occurs when an upward- or downward-sloping 200-day MA flattens out, signaling a notable change in trend that is worth paying attention to.
During a sideways trend, both rallies and selloffs tend to revert back toward the mean, making it most effective to “buy the dips and sell the rips.” However, this approach is better suited for experienced traders who are skilled at cutting losses quickly, since sideways trends eventually transition into either uptrends or downtrends.
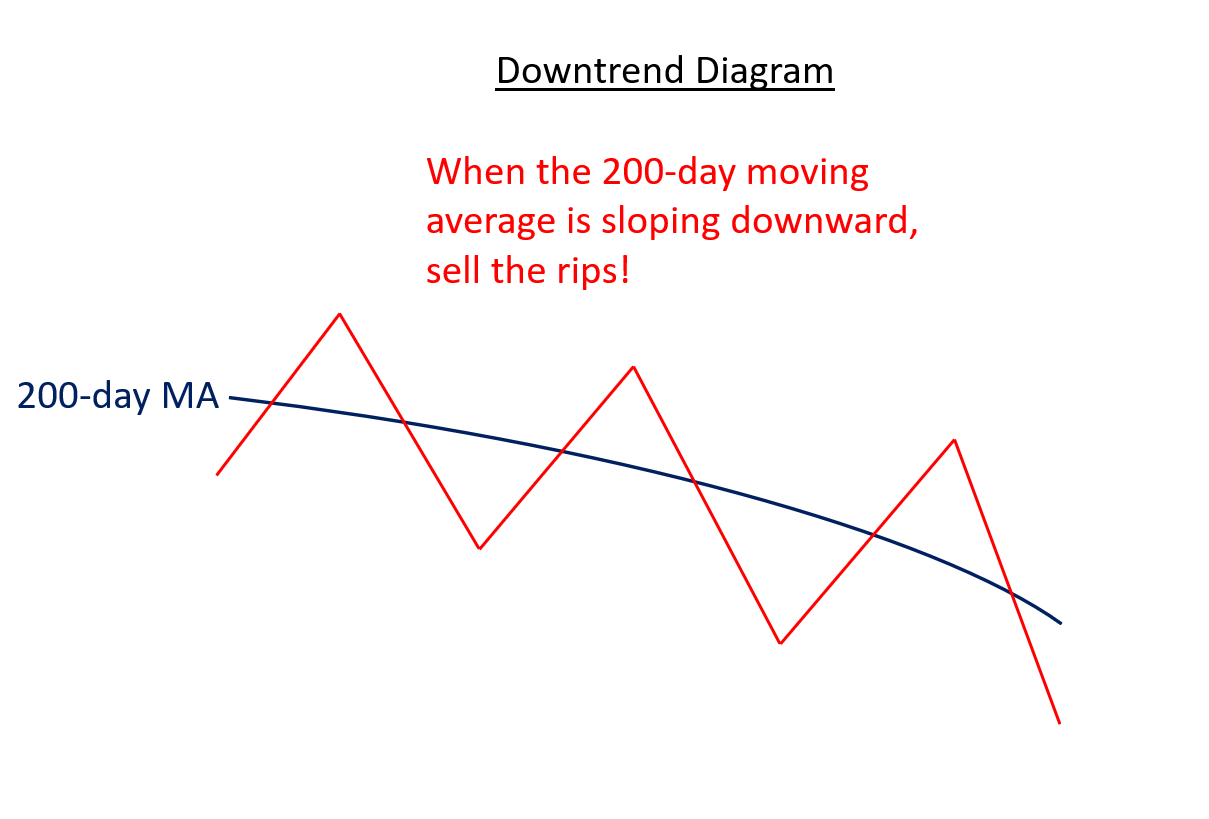
The final diagram shows a confirmed downtrend, indicated by a downward-sloping 200-day MA. This scenario is the inverse of the confirmed uptrend shown in the first diagram. In this condition, it makes sense to focus on the bearish case and disregard positive news and rallies, making it the time to “sell the rips.”
While many amateur traders believe it is always a good time to “buy the dips,” that approach is a terrible idea during a confirmed downtrend. It is one of the main reasons they lose money, as they are essentially trying to catch a falling knife. A better approach for those looking to buy is to wait until the moving average flattens out and then slopes upward again, putting the odds back in the bulls’ favor.
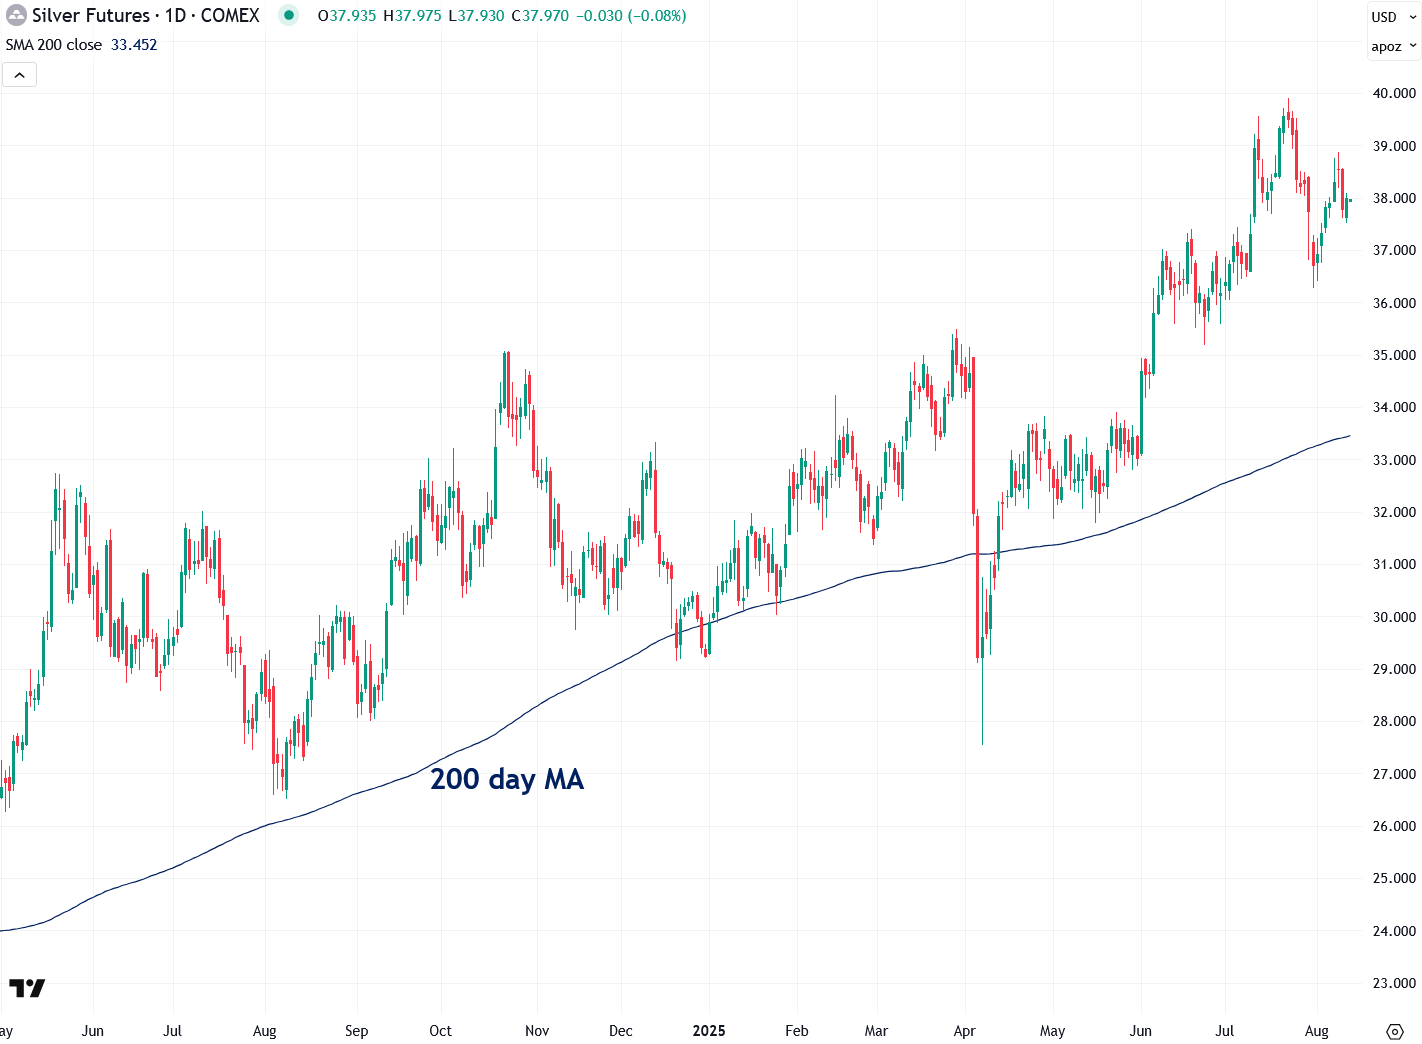
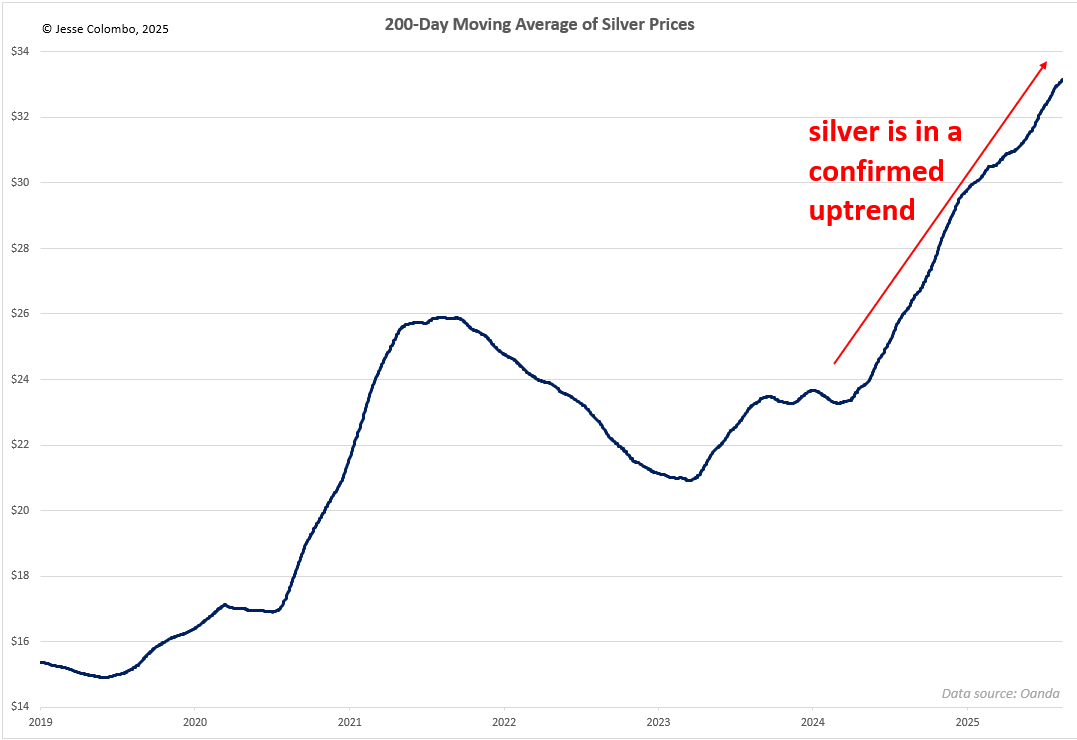
Next, I want to show a real-life example of the value of using the 200-day MA to cut out noise and focus on the big-picture trend. The chart below shows silver over the past 16 months, a period that has been extremely choppy, confusing, and frustrating. Yet, the 200-day MA has consistently indicated that silver has been in a confirmed uptrend—and it still is.
Because of that, I have remained consistently bullish on silver while tuning out the negativity, and I still am. Along the way, I have taken plenty of criticism and even lost some short-sighted and impatient paid subscribers. Yet, despite that, silver is now at 14-year highs, and I am profiting nicely from it. I believe this bull market is only just getting started (learn more).
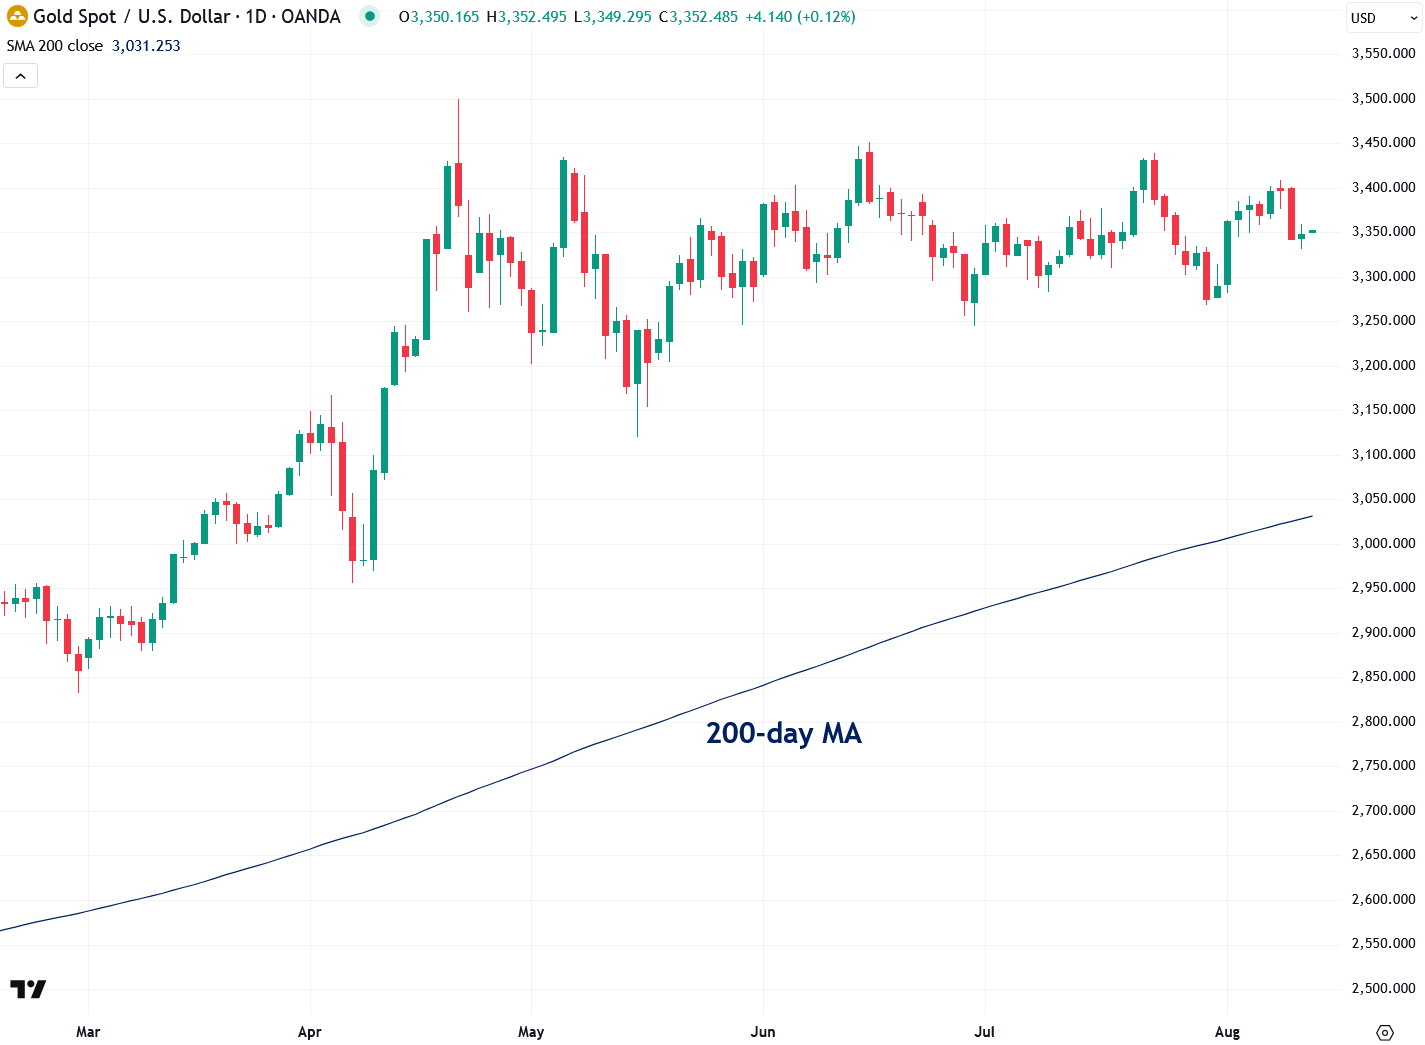
The next chart shows gold over the past four months, which has been trading sideways in a healthy summer consolidation pattern while digesting its large gains from the fall and spring. While many inexperienced investors and traders are growing impatient with gold, my focus remains on the upward-sloping 200-day MA, which indicates that gold is still in a confirmed uptrend. This means the odds favor another bullish move once this consolidation period ends and Wall Street comes back from vacation mode. (Plus, the long-term fundamentals are undeniably bullish and a breakout from this trading range gives a price target of roughly $4,400.)
As I have been saying, in a confirmed uptrend my approach is to tune out all negativity, whether it is related to tariffs, politics, geopolitics, inflation, economic reports, or even other popular analysts trying to call the top in gold. Many have attempted to do so throughout this bull market, and they have been flat-out wrong.
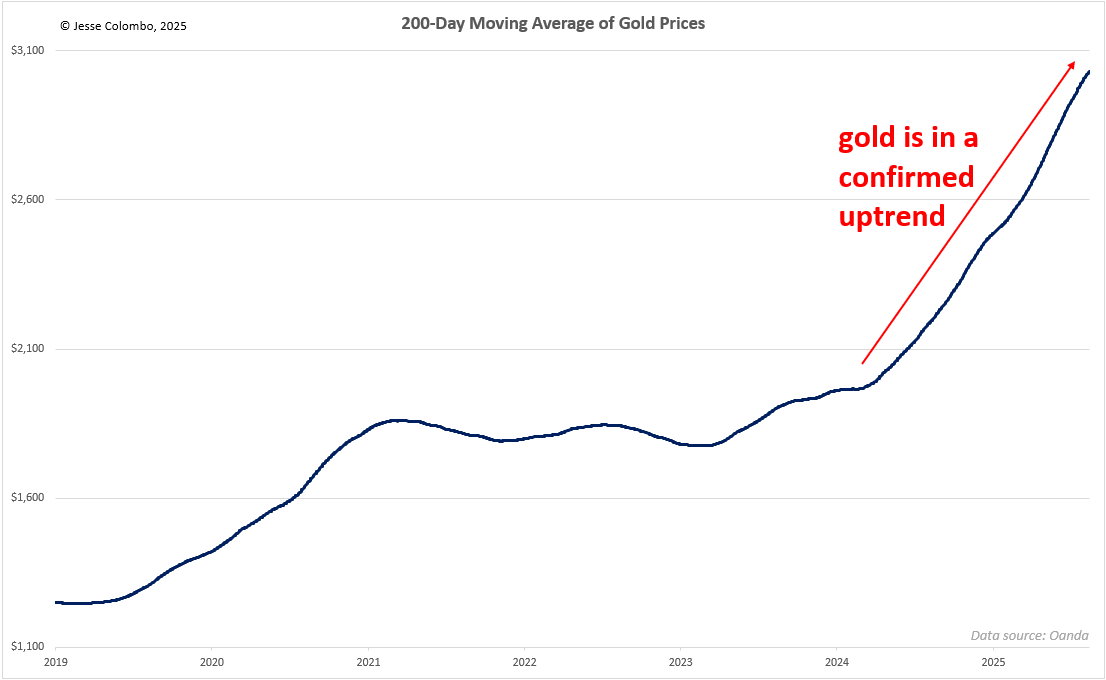
In the last two charts, I showed the 200-day MA plotted over the price charts of gold and silver. However, I sometimes like to plot the 200-day MA on its own to isolate it and focus more clearly on what it is indicating. This approach helps me worry less about day-to-day noise and concentrate instead on the direction the “supertanker” is headed, so to speak.
The chart below shows the 200-day MA of gold, which is sloping strongly upward. This indicates that gold is in a confirmed uptrend, so that is my bias, and I do not care about anything else. It is a simple heuristic, but it is highly effective.
The next chart shows the 200-day MA of silver, which is also sloping strongly upward. This is a clear signal to ignore the naysayers and day-to-day setbacks and focus on the bullish case. When I see this, my mindset is that the future is bright for silver, and I do not want my analyses biased or clouded by pessimists.
Lately, I have even received a few nasty emails from people upset that silver is down a mere $1.50 from its recent highs—never mind that it has risen significantly over the past two years and that I called the start of the bull market in early 2024.
I have also plotted the 200-day MA of the Synthetic Silver Price Index (SSPI), a proprietary indicator I use to confirm whether silver’s price moves are legitimate (learn more). This too is in a strong, confirmed uptrend, which bodes very well for silver.
(Note: Because of recent distortions in COMEX gold and copper futures caused by the Trump administration’s tariffs, I used a modified SSPI formula that incorporates the global spot price of gold and London Metal Exchange copper futures. The message remains exactly the same as the original. I will be writing an article on this soon.)

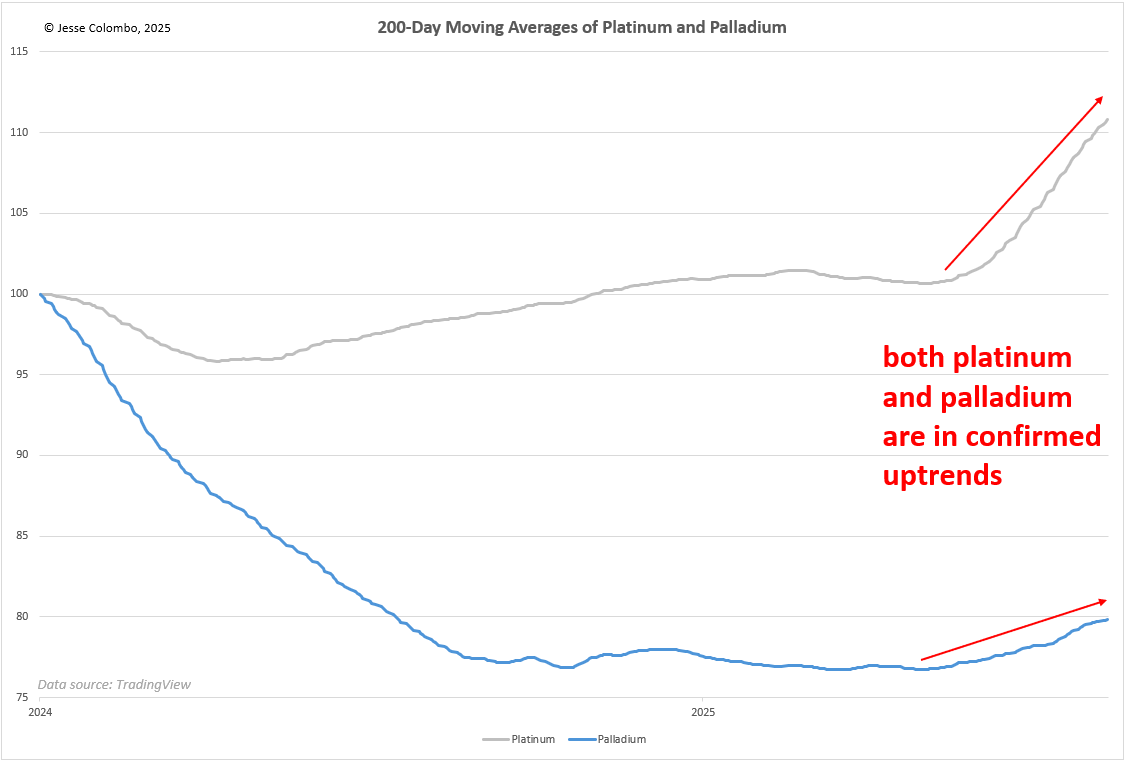
Although the bull markets in gold and silver have received the most attention over the past two years, platinum and palladium have begun to wake up in recent months. This is clearly reflected in the upward-sloping 200-day MAs of both metals. This development is also a positive sign that the overall precious metals bull market is becoming more broad-based and remains in its early stages. I recently published a report on my outlook for platinum and will be releasing one on palladium very soon.
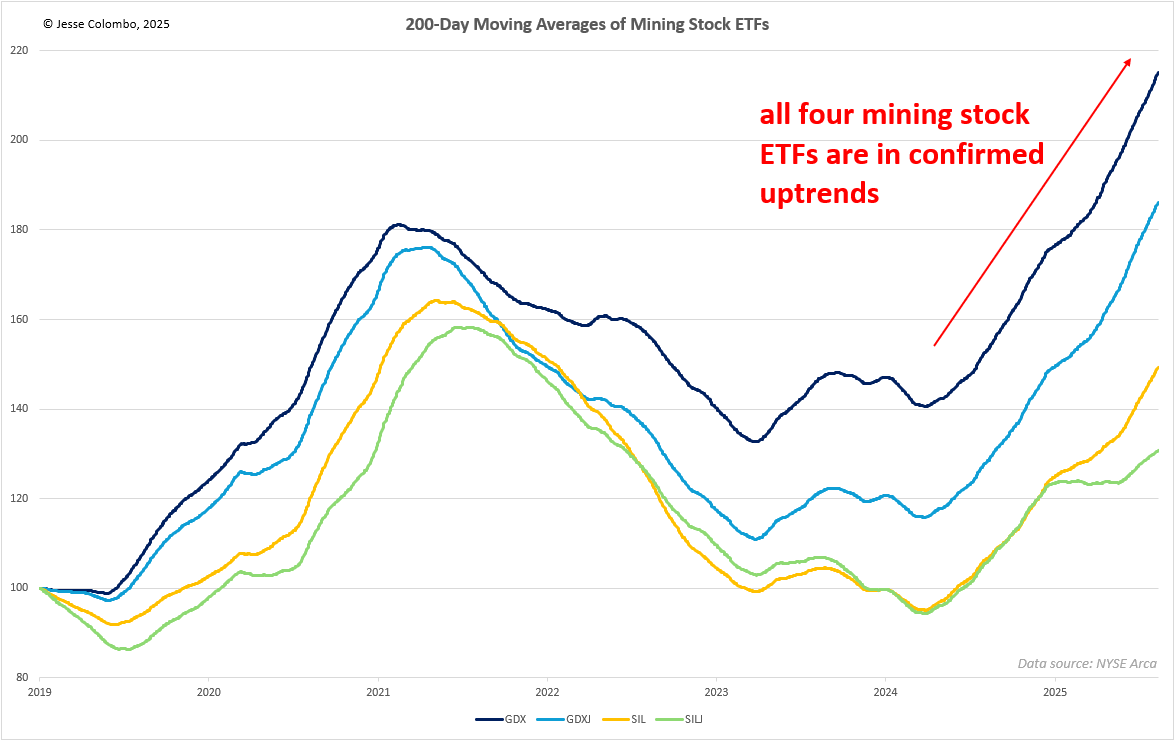
Not only are precious metals themselves in strong, confirmed uptrends, but so are gold and silver mining stocks. This can be seen in the chart below showing the 200-day MAs of the popular ETFs: VanEck Gold Miners ETF (GDX), VanEck Junior Gold Miners ETF (GDXJ), Global X Silver Miners ETF (SIL), and Amplify Junior Silver Miners ETF (SILJ).
It is worth noting that the gold mining ETFs have more strongly sloping 200-day MAs than the silver mining ETFs. This indicates that silver miners are lagging behind gold miners, which is typical in precious metals bull markets. However, I believe silver miners are about to catch up in a big way soon. I am very bullish on gold mining stocks, as I explained in a recent report, and I will be publishing a report on silver mining stocks soon.
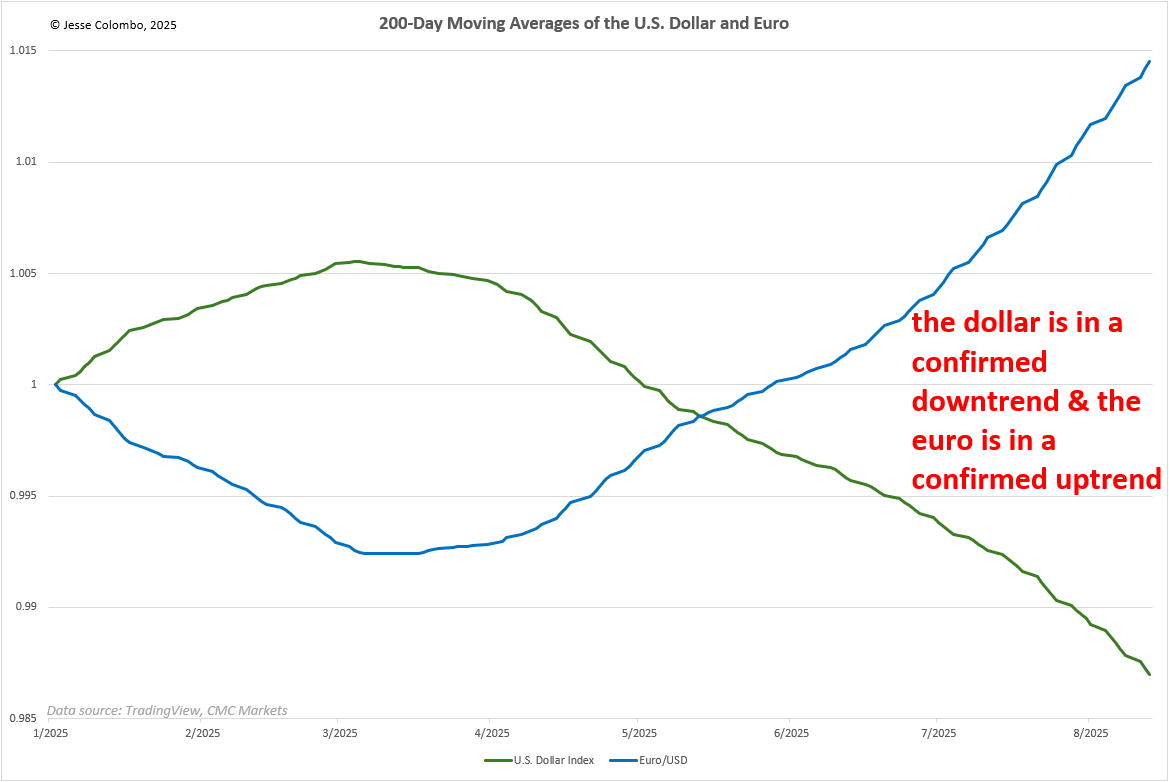
Using the 200-day MA to identify trends is useful for all assets, including currencies, which I also monitor closely because they strongly influence the direction of precious metals. The U.S. dollar, in particular, has an inverse correlation with precious metals, while the euro tends to have a positive correlation.
As I have explained in recent months, the dollar is in a confirmed downtrend and the euro is in a confirmed uptrend. You can see this in the chart below, and together these trends create a bullish tailwind for precious metals.
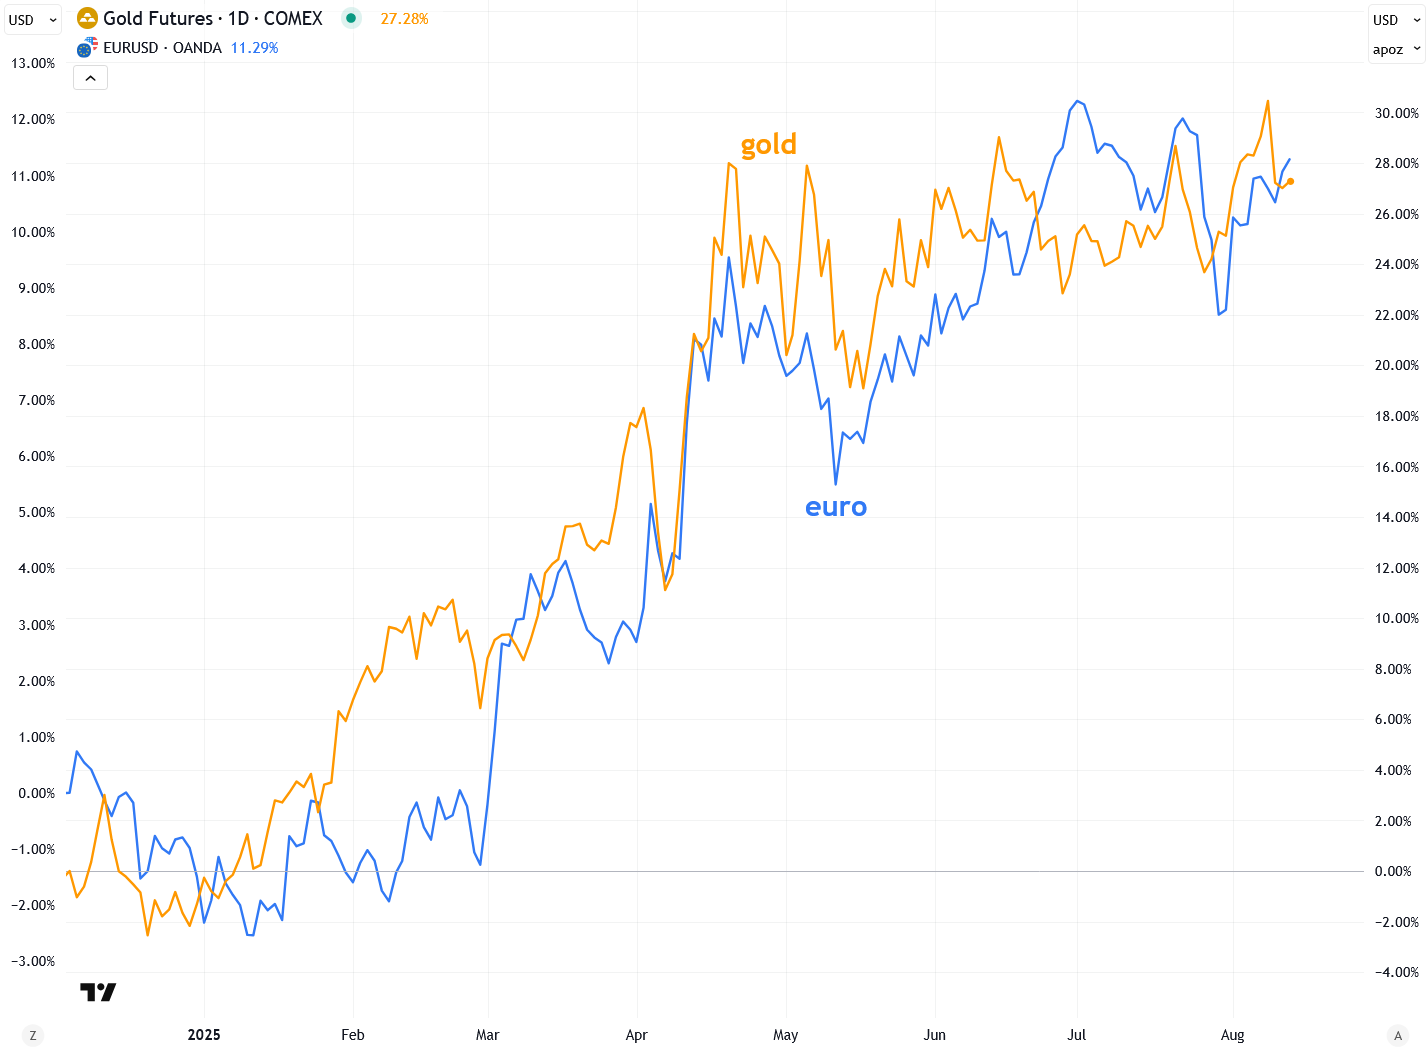
To confirm my point above, notice how closely gold and the euro move together—they are practically in lockstep. Since the euro is in a confirmed uptrend, and assuming that trend continues, it should help push gold even higher. On that note, read my recent update on why Morgan Stanley expects the euro to continue strengthening, which I explained would be a boon for the price of gold.
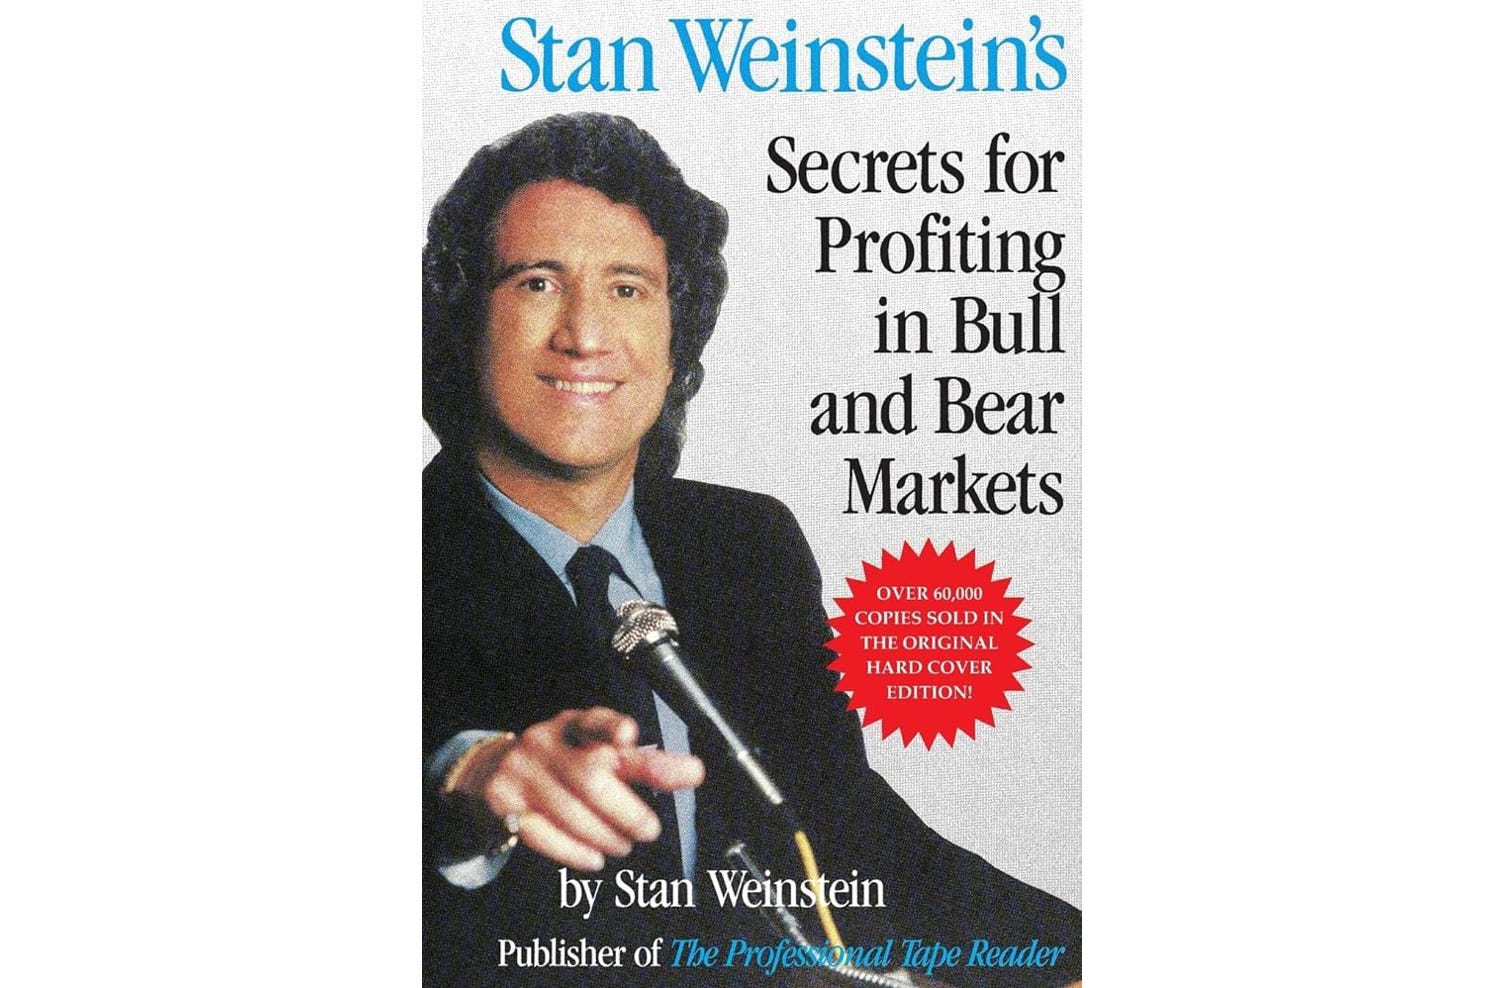
If you enjoyed today’s lesson on identifying and trading with the trend, I highly recommend one of my all-time favorite trading books—the 1988 classic Secrets for Profiting in Bull and Bear Markets by Stan Weinstein, available on Amazon. Stan makes extensive use of long-term moving averages similar to what I demonstrated in this lesson, along with his highly useful “Stage Analysis” approach. Although he uses the 150-day moving average instead of my preferred 200-day moving average, I have found little difference in real-world application after comparing the two.
If you are a mining stock investor in particular, this book is essential reading. It shows you how to recognize when the trend is changing so you know when to sell, which is critical for volatile mining stocks, which in my view are not buy-and-hold-forever investments, unlike gold and silver bullion.
To summarize, one of the most powerful principles in trading and investing is to trade with the trend, not against it. Doing so will dramatically increase your odds of success, keeping you in winning trades that continue higher while helping you exit—or avoid entirely—investments that turn into underperformers despite appearing “cheap” or like screaming buys, only to sink even lower.
By using the 200-day moving average, you can remove the guesswork from determining an asset’s trend and ignore day-to-day noise as well as conflicting opinions from the peanut gallery. On a tactical level, gold, silver, and their mining stocks are in undeniable, confirmed uptrends, and that is my sole focus right now while I tune out the naysayers.
I hope you found this lesson valuable and that it helps you in your trading and investing, as well as in better understanding the insights I share in this newsletter. If you enjoy trading lessons like this one, I also recommend checking out my two-part series (part 1, part 2) on how to identify and use support and resistance zones—another simple yet powerful technique that I rely on heavily in both my own trading and in the analyses I share in The Bubble Bubble Report.
If you’ve enjoyed this report or have any questions, comments, or thoughts, please give this post a like and share your thoughts in the comments below—I’d love to start a conversation and hear your perspective.