
In this update, I am introducing the newly reformulated Synthetic Silver Price Index (SSPI), a proprietary indicator I developed to help confirm whether moves in silver are genuine or simply noise, and to anticipate potential price moves in advance. This indicator has proven highly accurate and has earned the respect and fascination of my subscribers as well as myself.
To better understand the philosophy behind the SSPI, I recommend reading the in-depth guide I published a few months ago. Unfortunately, recent tariff-driven distortions in U.S.-traded COMEX copper and gold futures, the two components of the SSPI, forced me to revise the formula. The good news is that the updated version performs just as well as the original. In today’s update, I will walk you through the new formula, show how to use it to validate silver’s moves, and explain what it is signaling about silver right now.
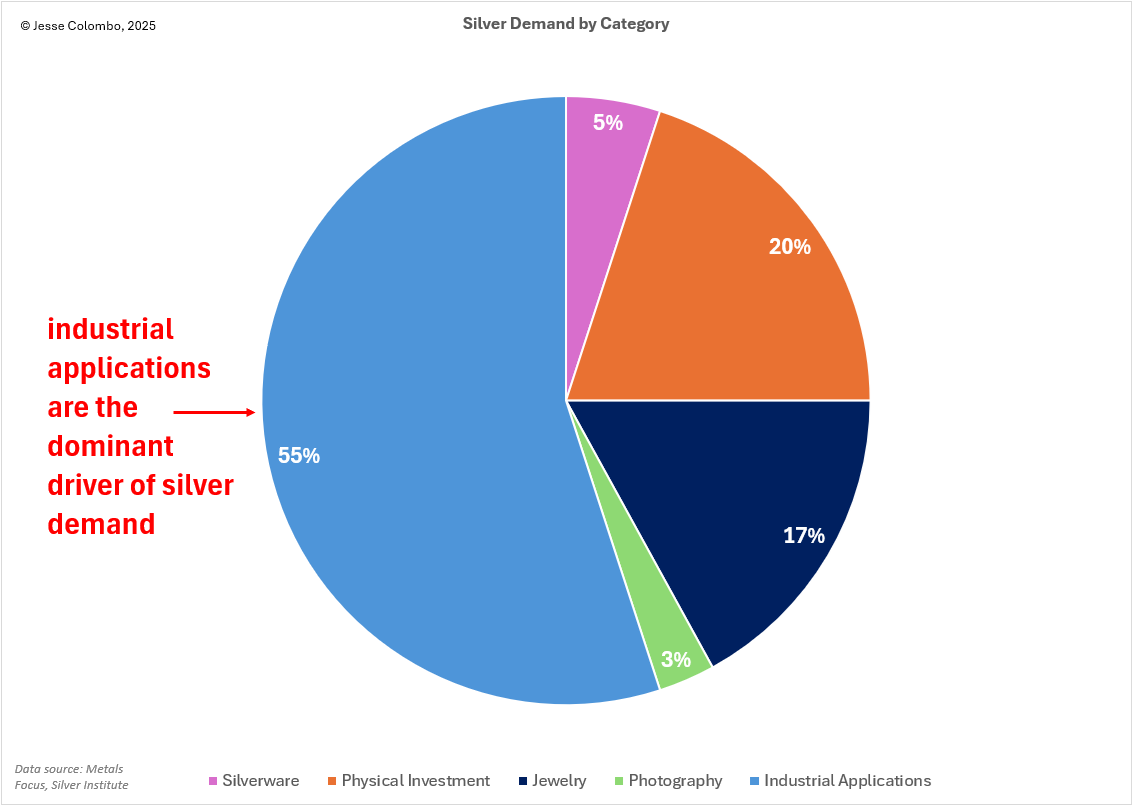
As I have been explaining in my updates over the past year and in the guide I published, I discovered that silver’s price moves are essentially a hybrid of gold’s and copper’s moves. This is because silver is both a precious metal and an industrial metal (as shown in the chart below), and apparently, arbitrage trading algorithms take cues from both gold and copper to pull silver along with them.
When gold and copper are rising, chances are silver will rise as well, and vice versa. Furthermore, if silver is making a move that is not confirmed by gold and copper, chances are it is a false move in silver that will then reverse, often violently. Very often, these false moves are deliberately engineered by the bullion banks to manipulate and suppress the price of silver, as I explained in this report.
So I created the original Synthetic Silver Price Index by averaging the prices of gold and copper, adjusting copper by a factor of 540 to prevent gold’s much higher price from exerting undue influence. The original SSPI used U.S.-traded COMEX copper and gold futures, and it can be tracked on TradingView and other platforms using the formula: (540*HG1! + XAUUSD)/2. Lo and behold, I discovered that even though silver itself is not included in the formula, the SSPI is highly correlated with silver’s price—showing an impressive five-year correlation of 84%.
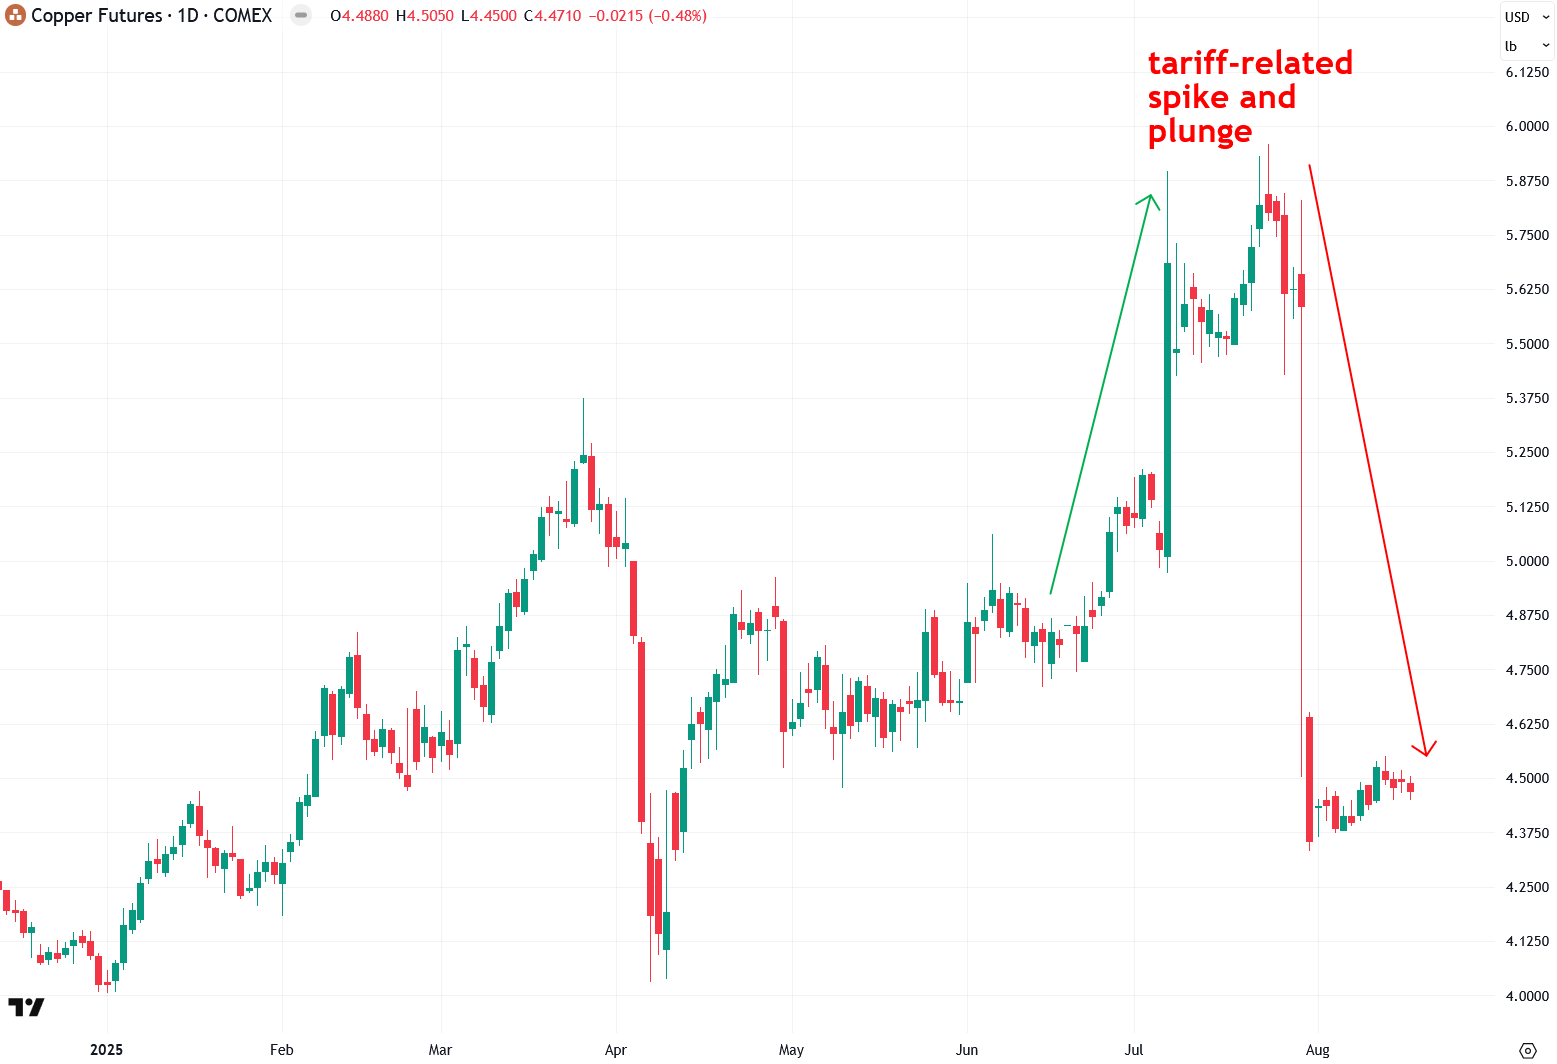
Now let’s discuss why I had to modify the formula (and I’ll share the new one shortly, but first I want to explain the reason). In July, COMEX copper futures went on a head-spinning round trip. They first surged 13% on initial news that U.S. copper imports would be tariffed, then plunged 20% when it was revealed that the tariffs would not apply to copper cathodes, which are what COMEX copper futures are based on. You can see that dizzying move in the chart below.
In recent weeks, a similar but less extreme spike and drop occurred in COMEX gold futures (learn more). This was driven by initial speculation that the Trump administration would impose tariffs on gold bullion imports, but that was later denied:
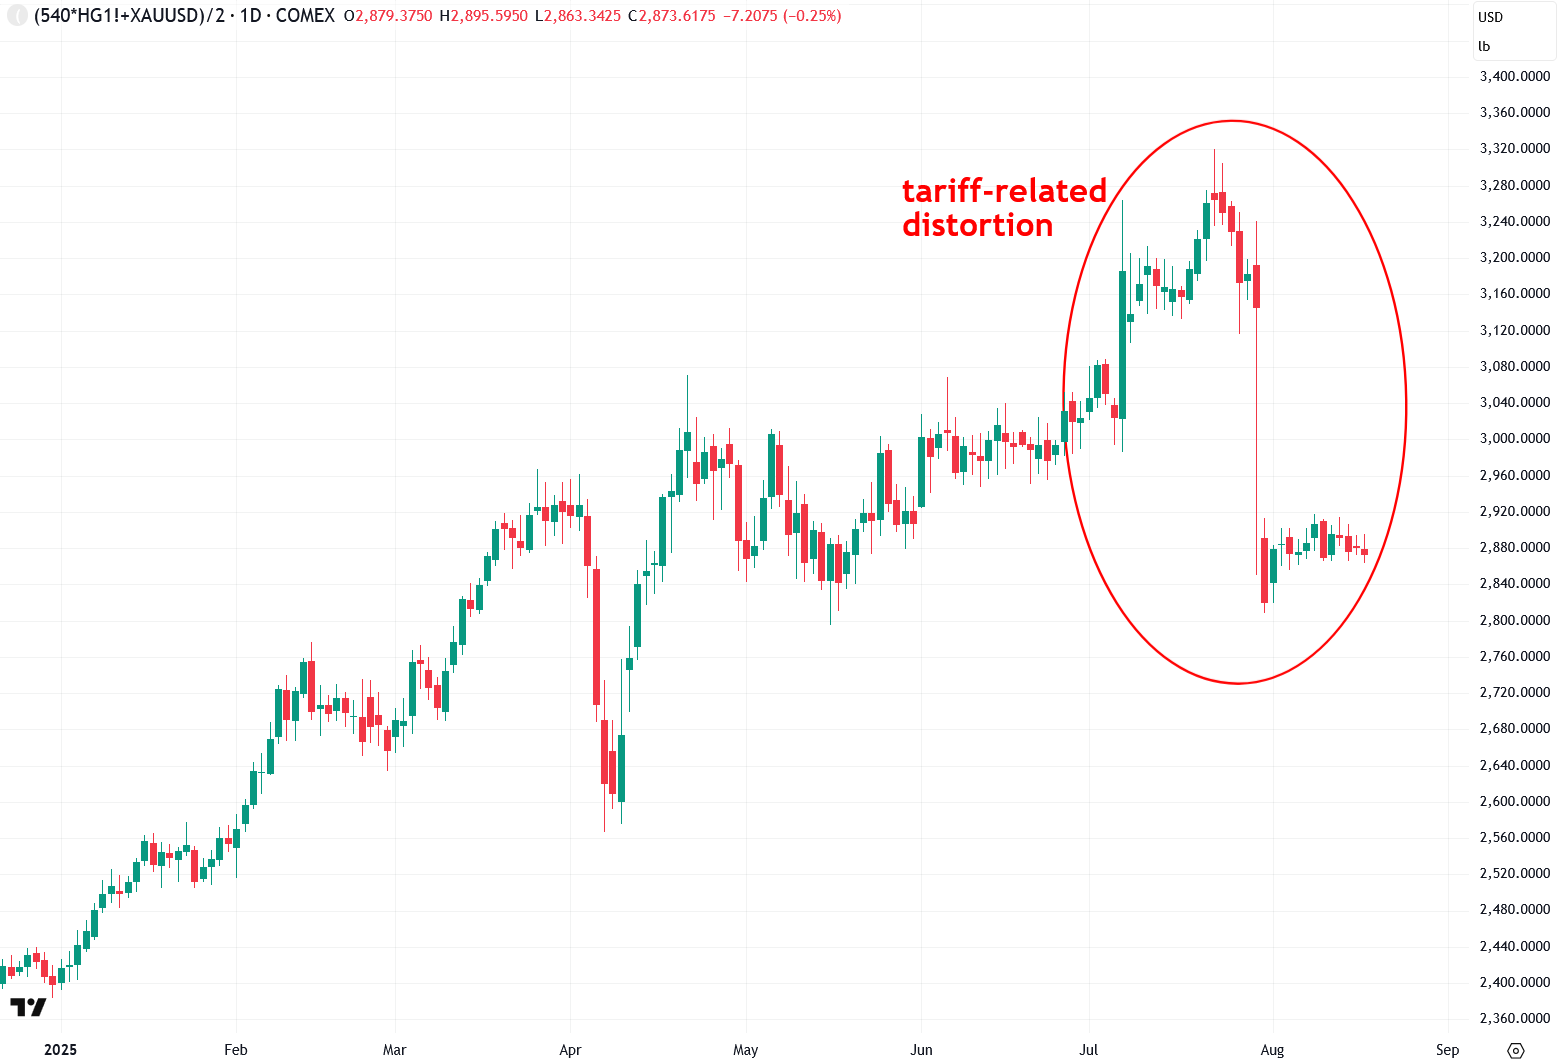
What’s important to note is that the tariff-related distortions affected only U.S.-traded COMEX gold and copper futures, not global spot prices or futures contracts traded outside the United States. However, because my original Synthetic Silver Price Index formula relied on COMEX gold and copper futures, it became distorted as well, as shown in the chart below, and was no longer as effective for confirming or predicting price moves in silver.
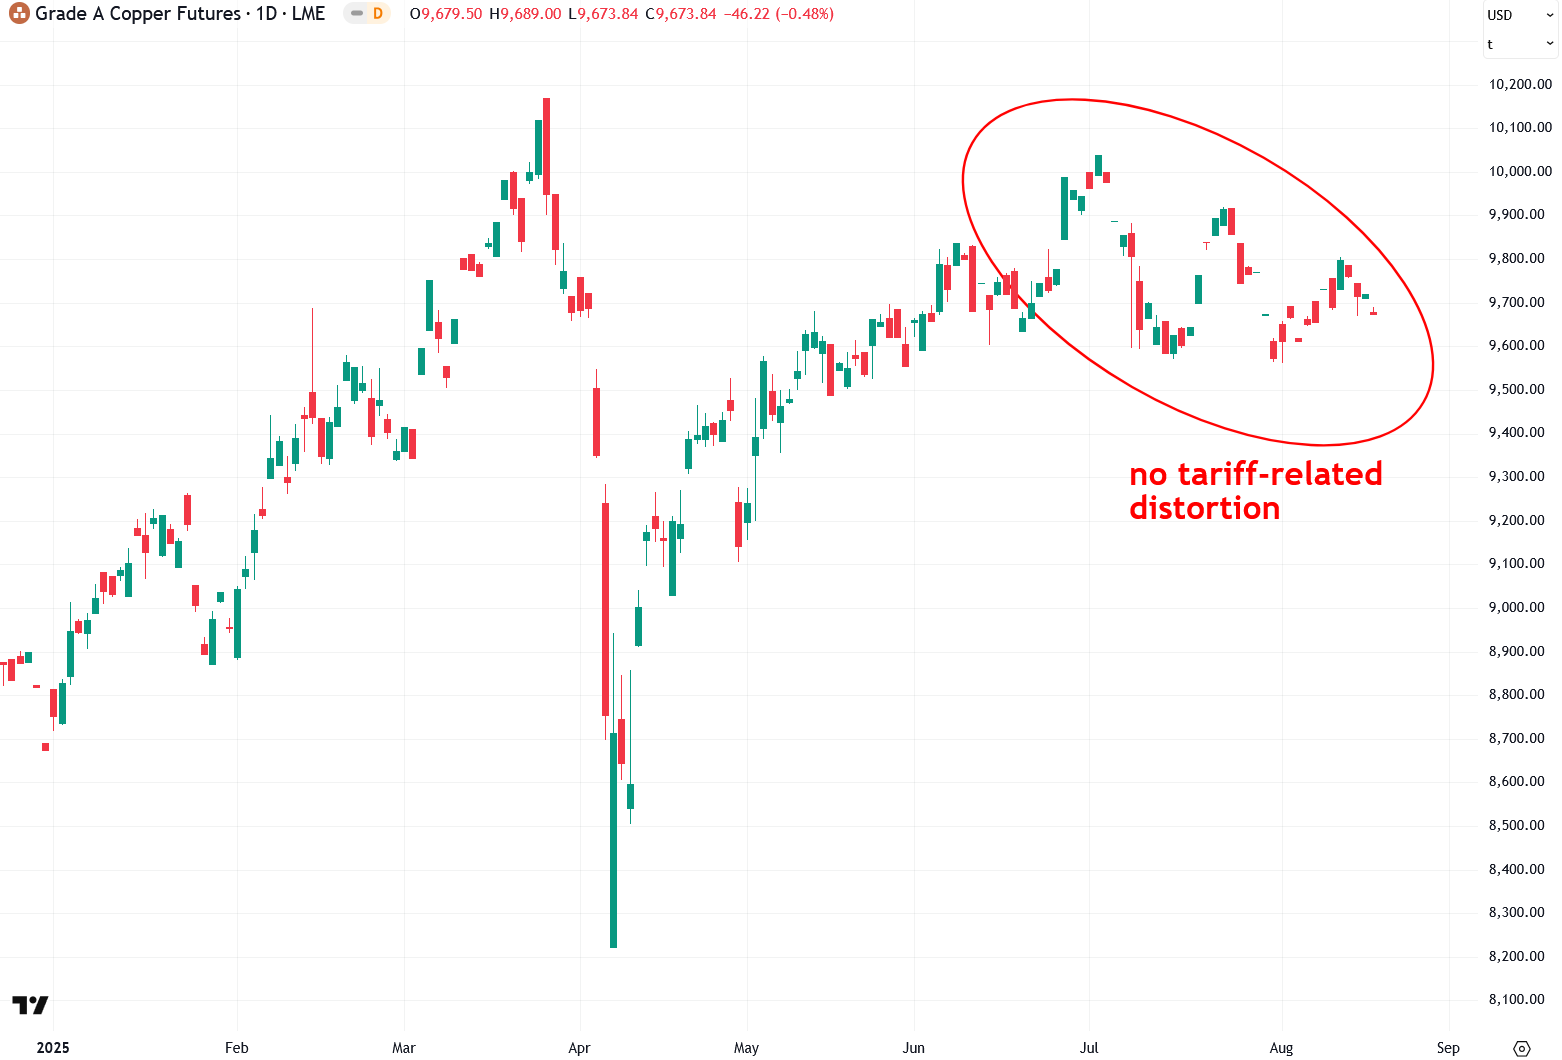
Thankfully, those tariff-related distortions were confined to U.S.-traded futures, while global gold and copper prices remained largely unaffected. This is clearly illustrated in the chart of London Metal Exchange (LME) copper futures below:
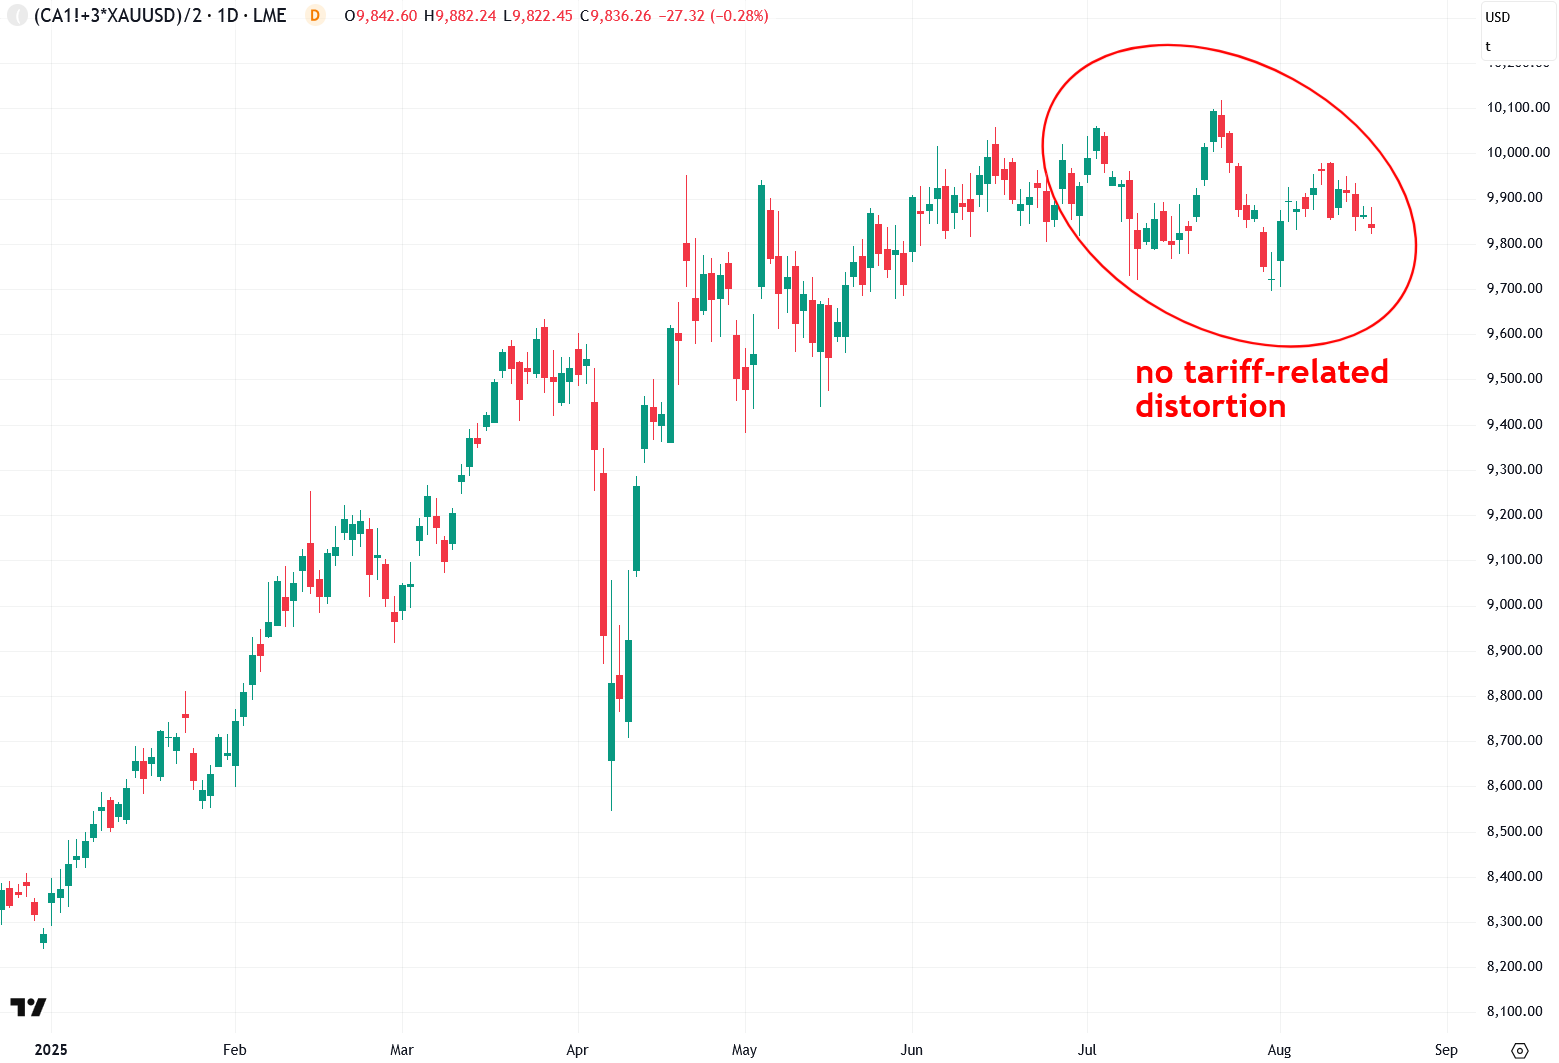
Therefore, I decided to reformulate my Synthetic Silver Price Index using the globally traded spot price of gold and London Metal Exchange copper futures. The new formula is (CA1! + 3×XAUUSD)/2 and can be tracked on TradingView and similar charting platforms. I multiplied the price of gold by three to give gold and copper roughly equal weight in the index.
As you can see in the chart of the new SSPI below, it is free of the tariff-related distortions that affected the original formula. This makes it a reliable indicator once again for predicting and confirming price moves in silver.
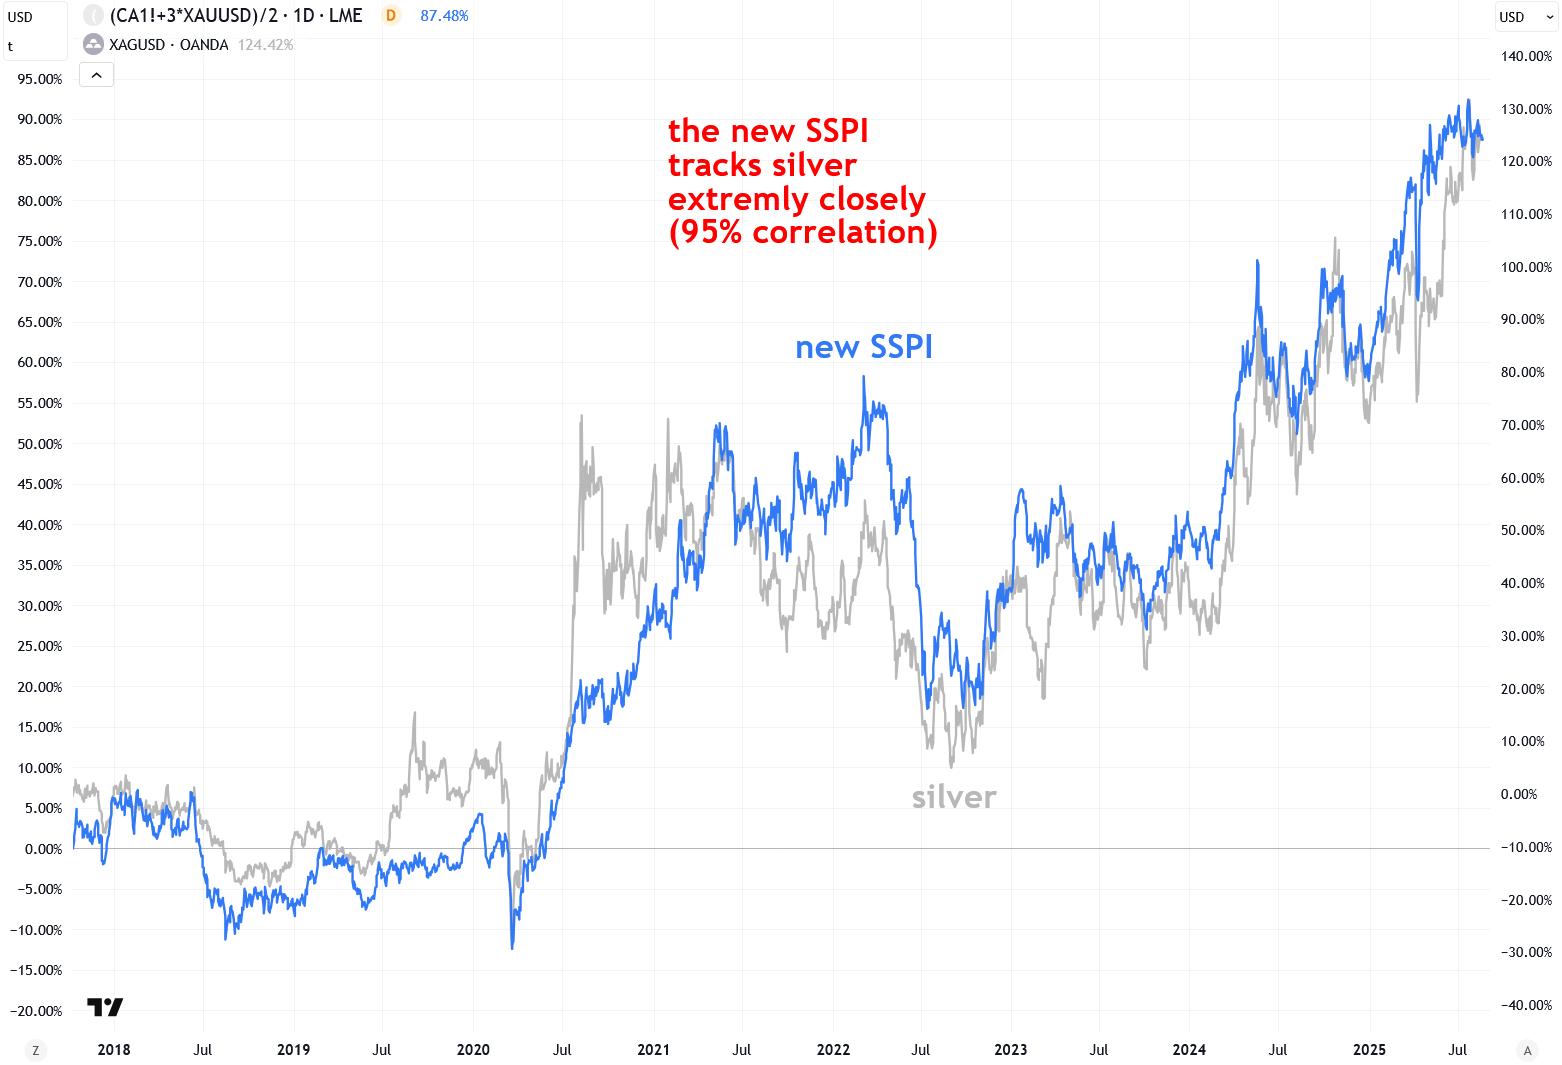
To confirm that the new SSPI is still a valuable indicator for silver, I ran a correlation analysis using weekly data going back to 2018. The result was an impressive 95% correlation with the spot price of silver. This extremely high correlation is also clearly visible in the chart below. In short, the new formula is a success, and we are back in business.
Now I want to show some of the ways the new Synthetic Silver Price Index can be used to predict and confirm moves in the price of silver.
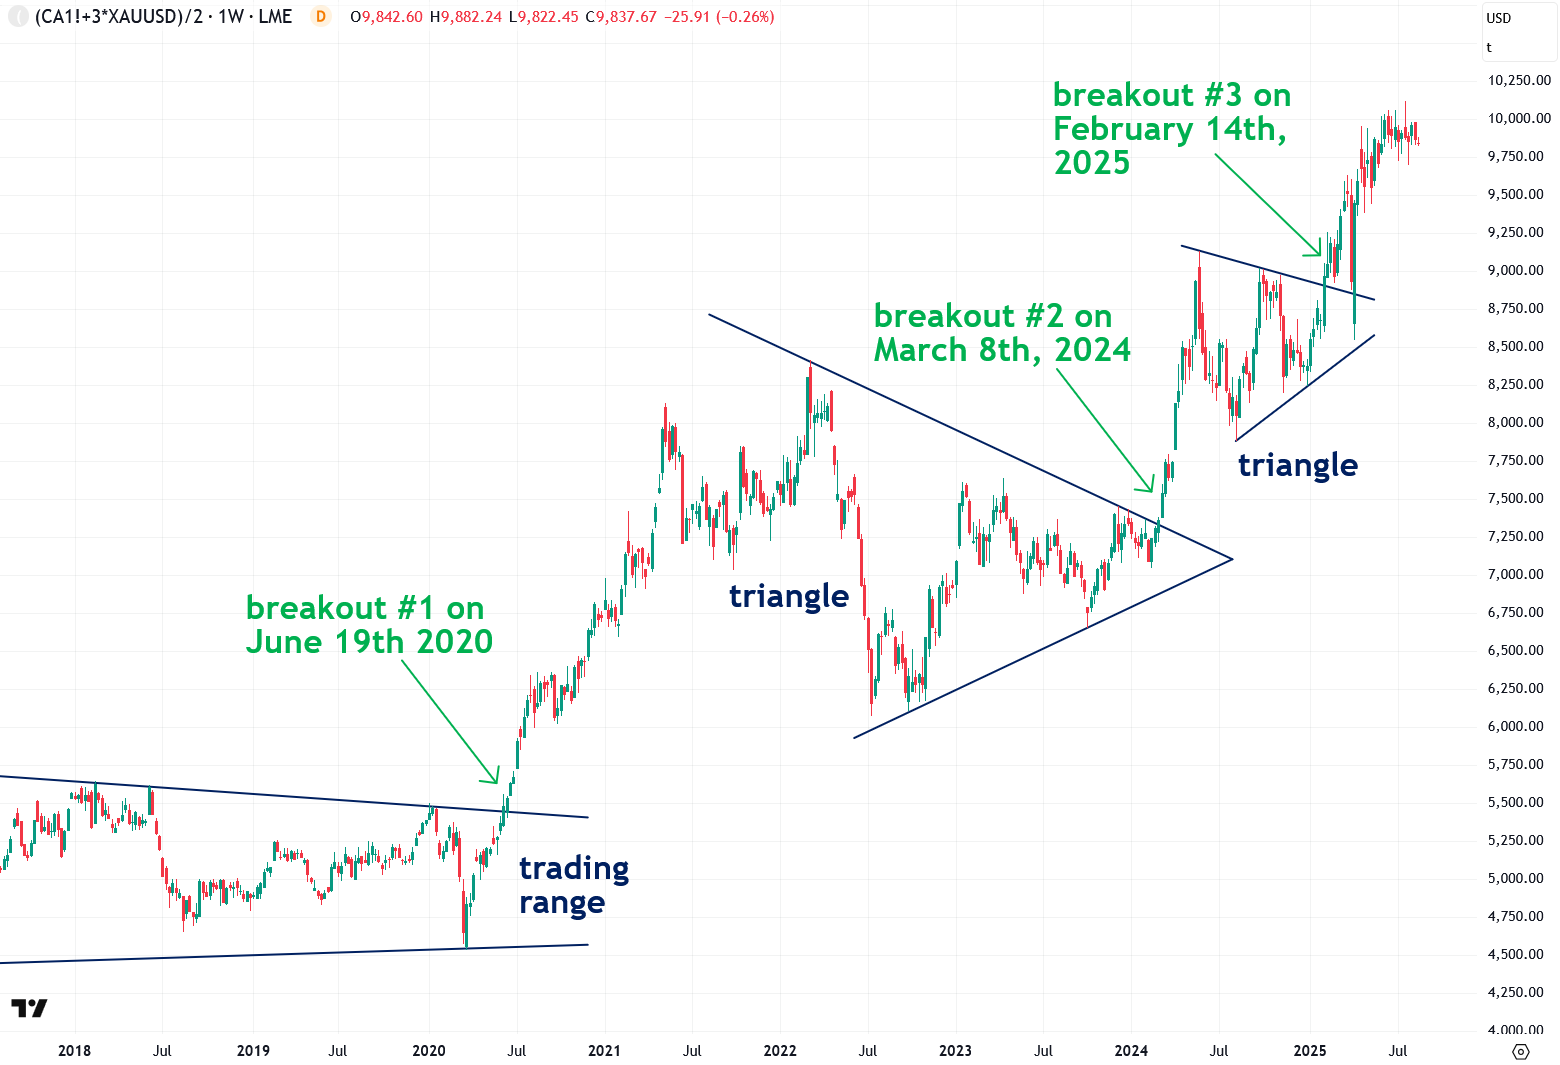
One effective approach is to perform chart analysis on the SSPI to spot potential moves in silver ahead of time. This can be done by identifying chart pattern breakouts in the SSPI that generate buy or sell signals for silver itself, as demonstrated in the chart below. In this example, I waited for the weekly close of trading to stay conservative. However, the same approach can be applied using the daily close to generate even earlier, though potentially less reliable, signals.
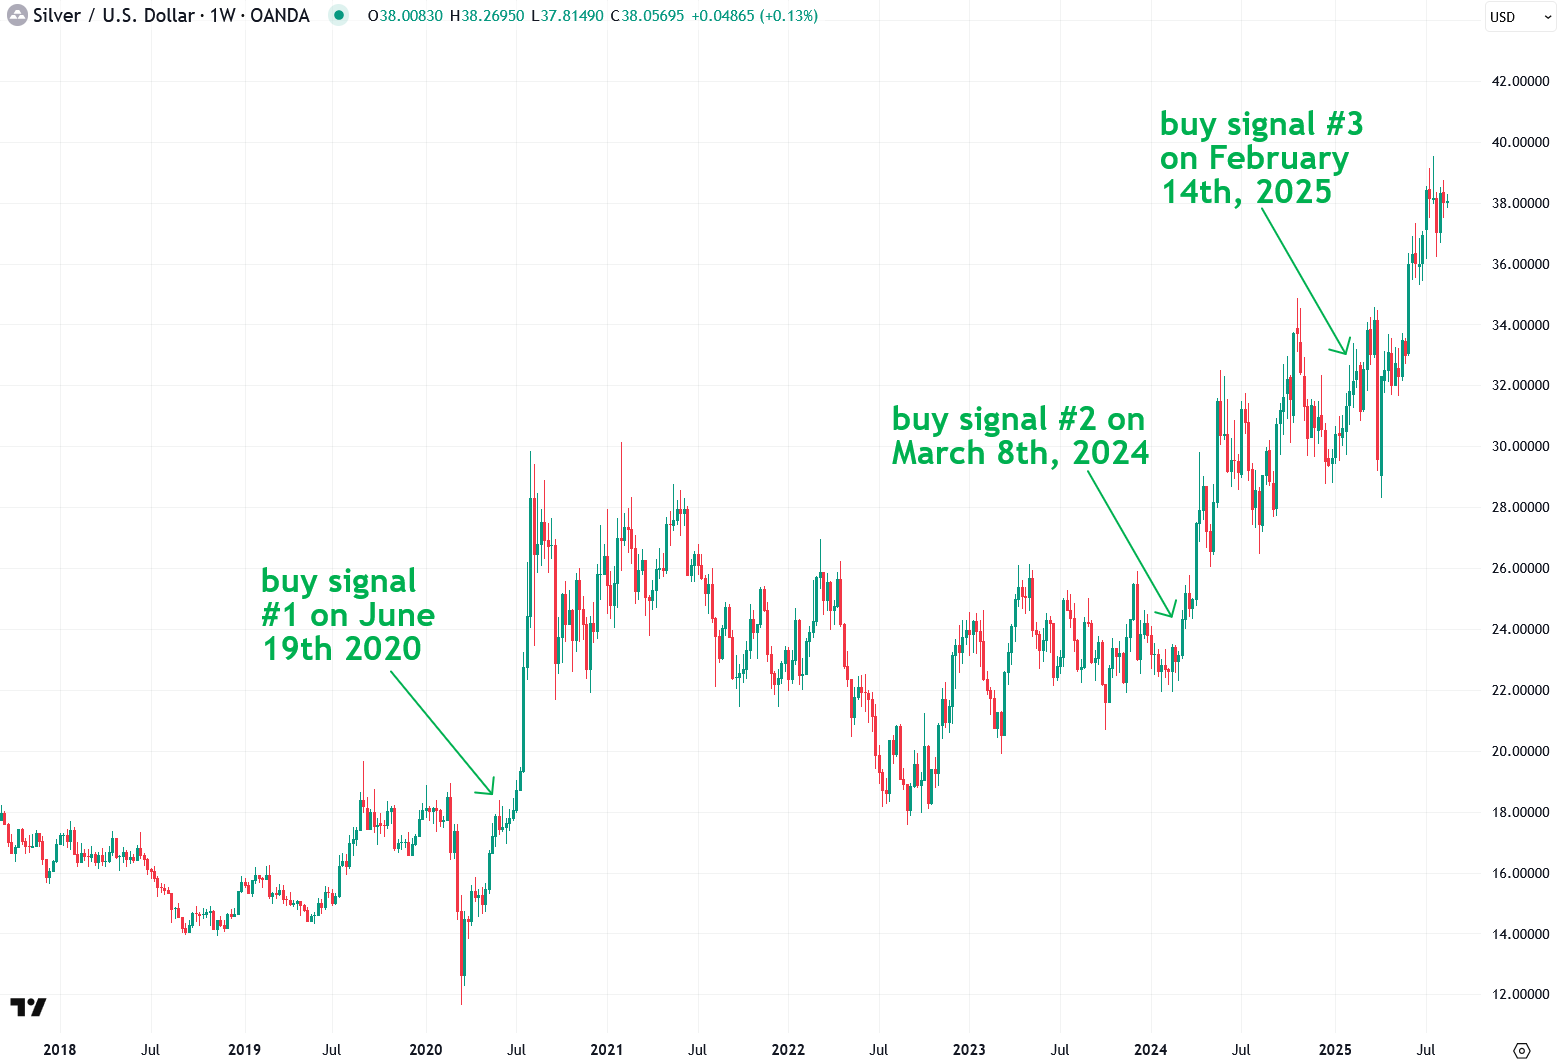
Next, let’s take a look at the weekly spot price of silver and overlay the buy signals generated from breakouts in the SSPI. Sure enough, the SSPI produced some strong buy signals that likely would not have been identified by analyzing silver’s price alone. This is likely because silver was reacting to bullish moves in both gold and copper, prompting arbitrage trading algorithms to buy silver in sympathy, which then pulled it higher.
Another valuable way to use the Synthetic Silver Price Index is to plot its 200-day moving average and examine its slope to determine whether the SSPI is in a confirmed uptrend, downtrend, or sideways trend. This follows the methodology I discussed in my guide last week.
Since March 2024, the SSPI has entered a confirmed uptrend based on its 200-day moving average, which was followed by significant gains in both the SSPI and silver itself. It is also important to note that the SSPI remains in a confirmed uptrend, signaling a strong tailwind for the price of silver.
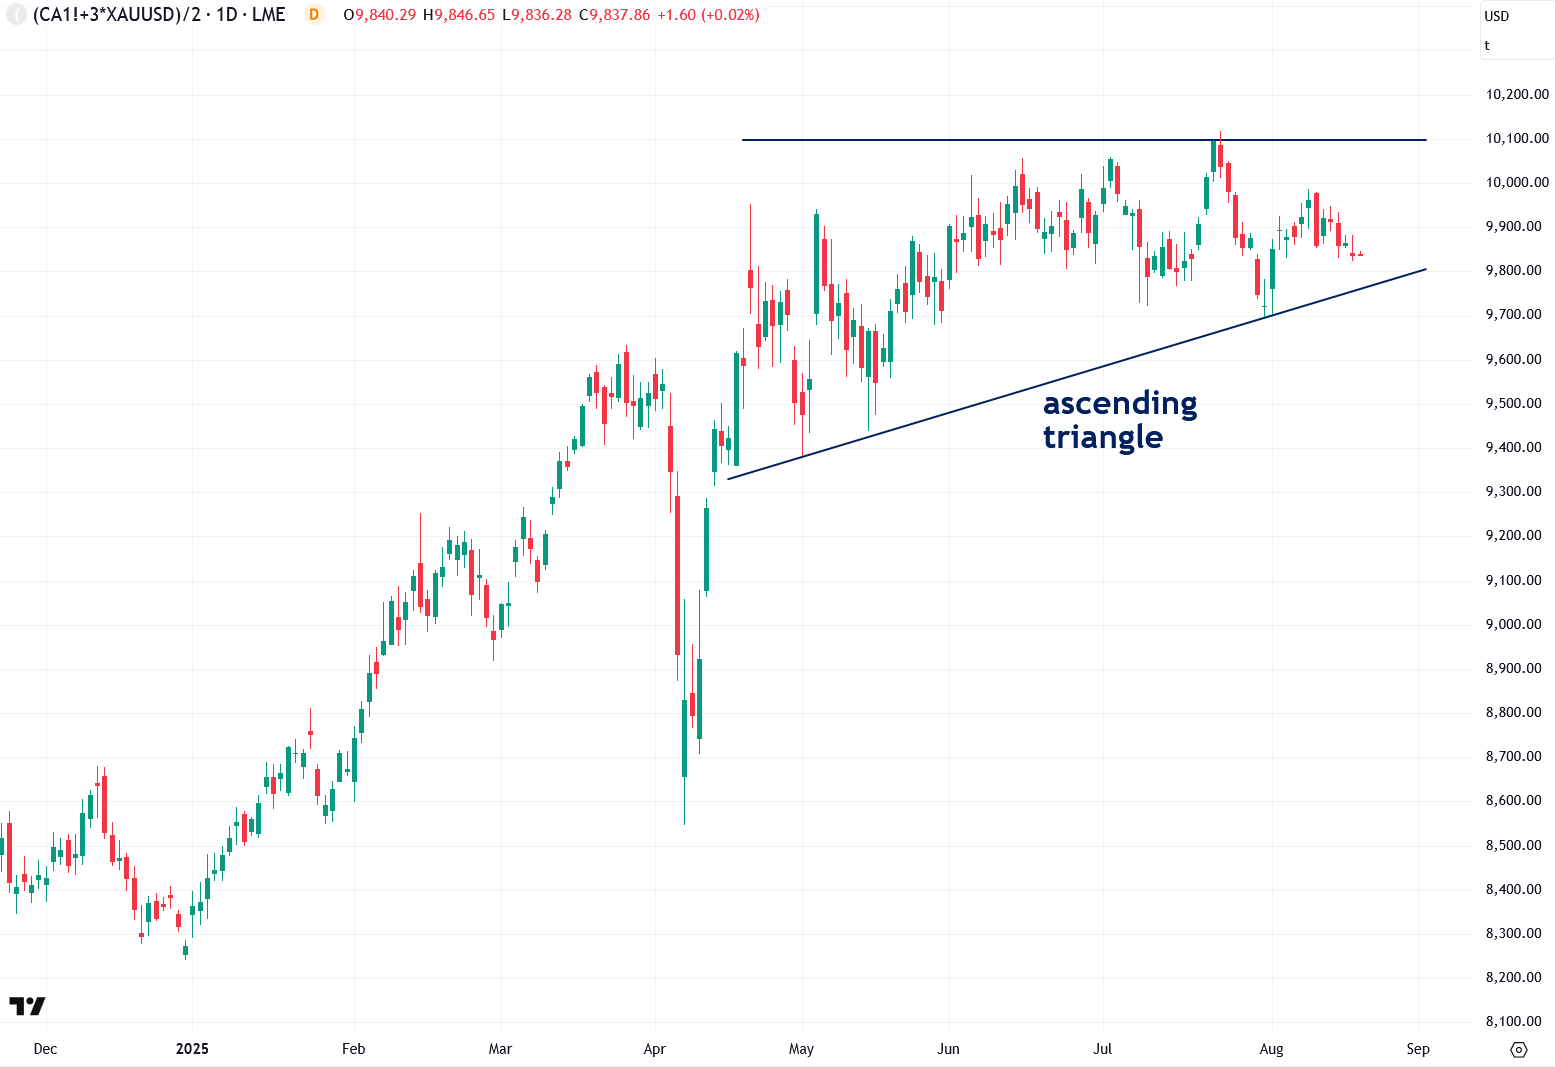
Finally, I want to perform a simple chart analysis of the SSPI to assess where it currently stands and what it may be signaling for silver. Although the SSPI has been roughly flat over the past five months, it appears to be forming an ascending triangle pattern—a bullish formation, especially when it develops within a strong uptrend like the one in place now.
Right now, we are still in the final weeks of summer, and trading volume, market activity, and news flow remain relatively low as Wall Street is still in vacation mode. The scenario I am now watching for is a convincing breakout from the SSPI’s ascending triangle pattern once fall begins and trading volume returns, along with traders getting back to business. If this breakout does occur, it would be a highly bullish signal for silver and should propel prices to $40, $50, and beyond.
To wrap things up, I hope you found this explanation and update on the Synthetic Silver Price Index helpful. I covered the newly revised formula, which removes tariff-related distortions, and the various ways it can be used to predict and confirm price moves in silver.
I know the precious metals market feels quiet and uneventful right now, but this is not the time to grow frustrated or lose focus. Some of the most powerful moves tend to emerge from periods like this, and I’m feeling optimistic as we head into the fall. That said, I am still waiting for confirmation in the form of strong bullish breakouts, as I take a reactive rather than predictive approach. As always, I will keep you updated on what I’m seeing.
If you’ve enjoyed this report or have any questions, comments, or thoughts, please give this post a like and share your thoughts in the comments below—I’d love to start a conversation and hear your perspective.