
Gold’s price action over the past five months has been slow and uneventful, with many investors growing bored, impatient, and even concerned that the top is in and the bull market that began in March 2024 is already over. As I’ve been explaining, however, this kind of sideways movement is normal and healthy as gold takes time to consolidate and digest its earlier gains, particularly during the summer when trading volume is light and Wall Street is in vacation mode. In today’s update, I want to highlight something else: gold is currently in a “volatility squeeze,” a technical setup that often signals a big move ahead and should be seen as a reason for optimism, not concern.
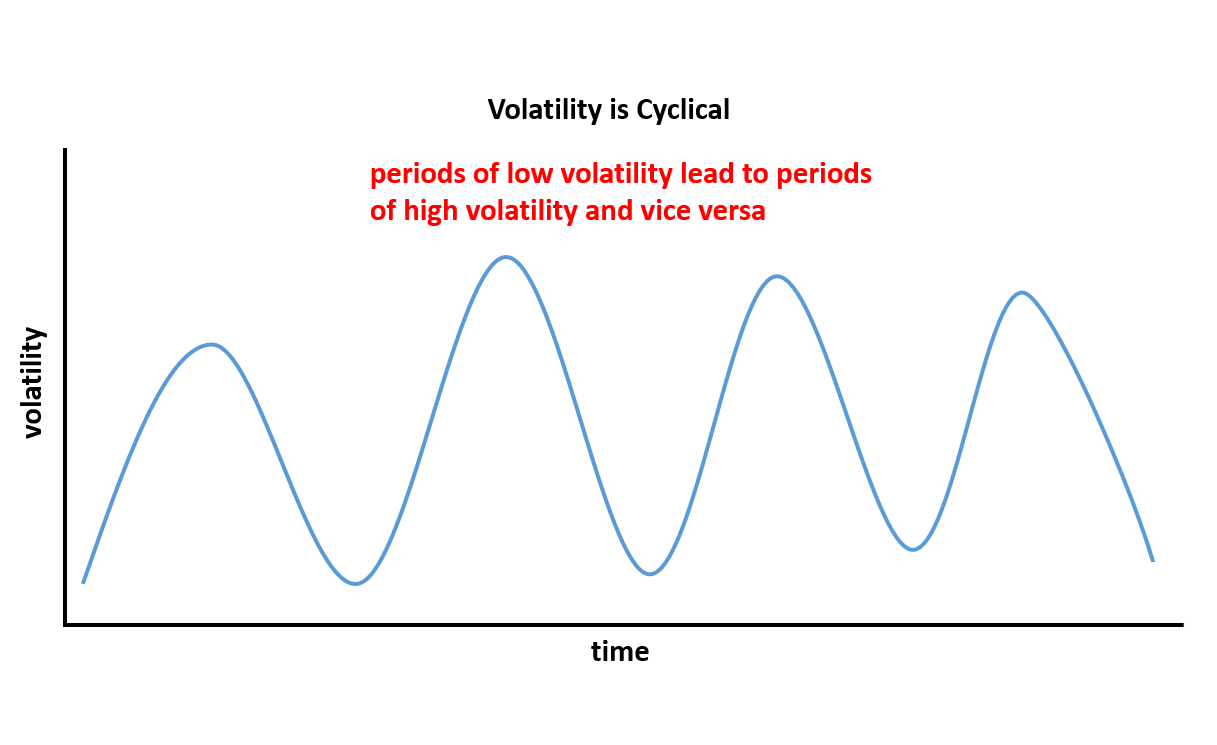
To better understand today’s lesson and update, it helps to know that volatility is highly cyclical. While asset prices like precious metals and stocks may not follow clear cycles, the volatility of those prices does—consistently moving through repeating phases of low and high volatility. Periods of quiet, low volatility tend to build pressure that leads to sharp spikes in volatility, which then eventually subside, starting the cycle again. See the diagram below for a visual of this repeating pattern.
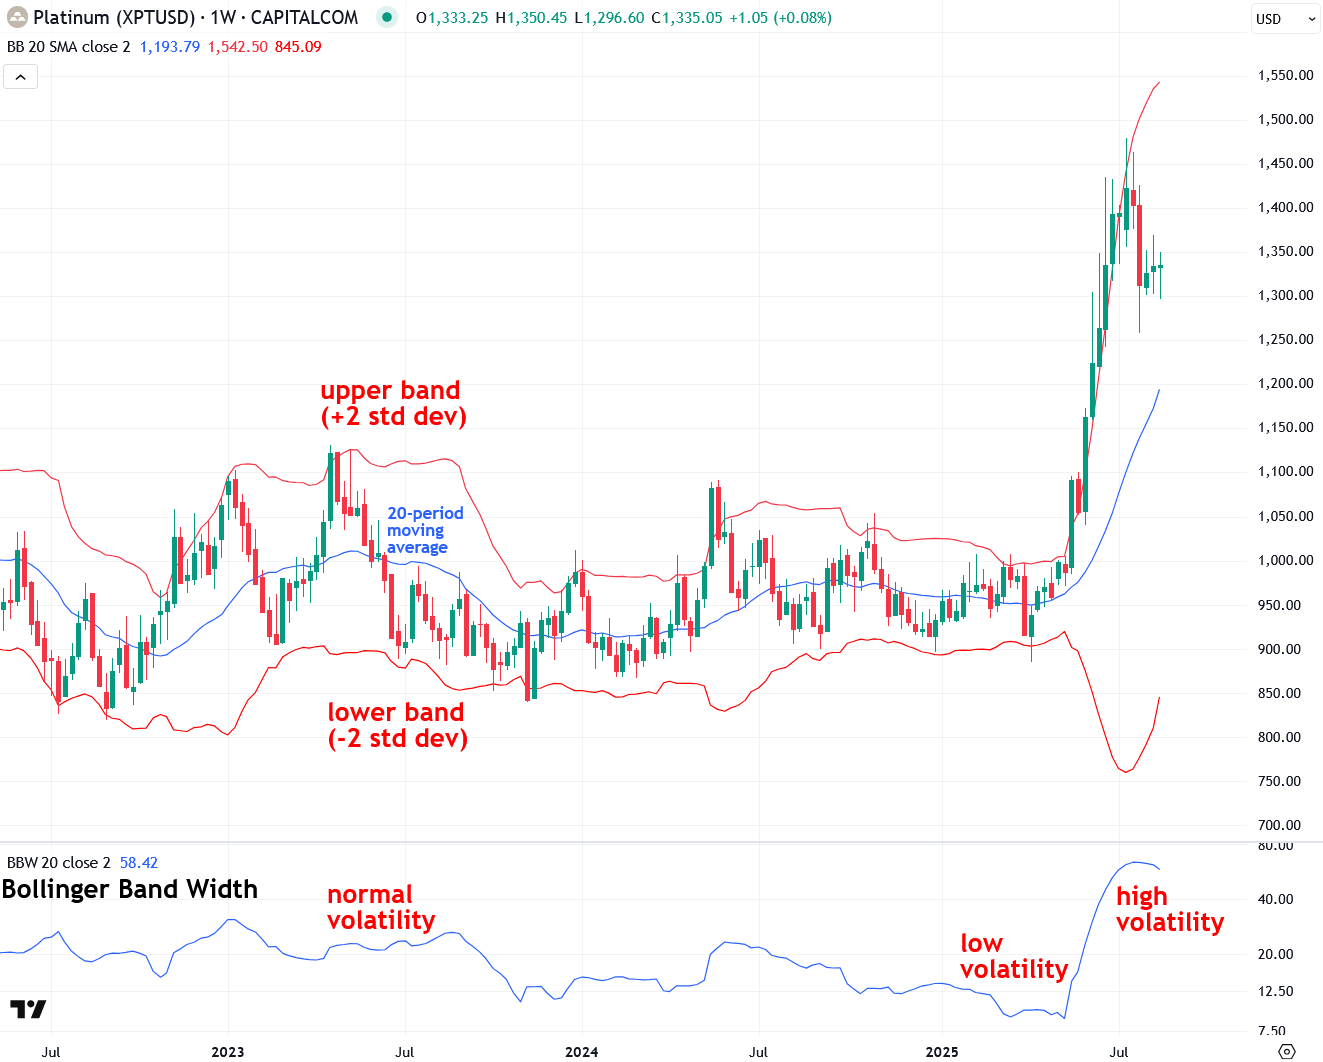
So how can volatility be measured and monitored in the real world? While there are a number of ways to do this, one of the most efficient and widely followed is to use an indicator called Bollinger Bands, which, when applied to a chart of an asset such as platinum in the example below, envelope the price. The way the Bollinger Bands indicator works is that it takes a 20-period moving average of the asset’s price (the blue line in the chart below), and then upper and lower bands (the red lines in the chart below) are plotted two standard deviations above and below the moving average.
There are several ways to use Bollinger Bands, such as treating the upper band as a resistance level and the lower band as a support level. However, that’s not the focus today. Instead, I’m going to focus on the width of the Bollinger Bands as a way to measure the volatility of the asset they’re applied to. Simply put, when the bands are close together, the asset has low volatility; when the bands are wide apart, the asset is experiencing high volatility—based on the past twenty trading periods, whether measured in days, weeks, or another timeframe.
While it’s easy to eyeball the Bollinger Bands to gauge their width and the asset’s volatility, there is another helpful related indicator called Bollinger Band Width that makes this even easier. You can see it plotted on platinum’s weekly chart below. The chart shows clear periods of normal volatility, low volatility, and high volatility. When an asset moves sideways for a while, volatility is low, and when it trends strongly either up, as platinum has in recent months, or down, volatility is high.
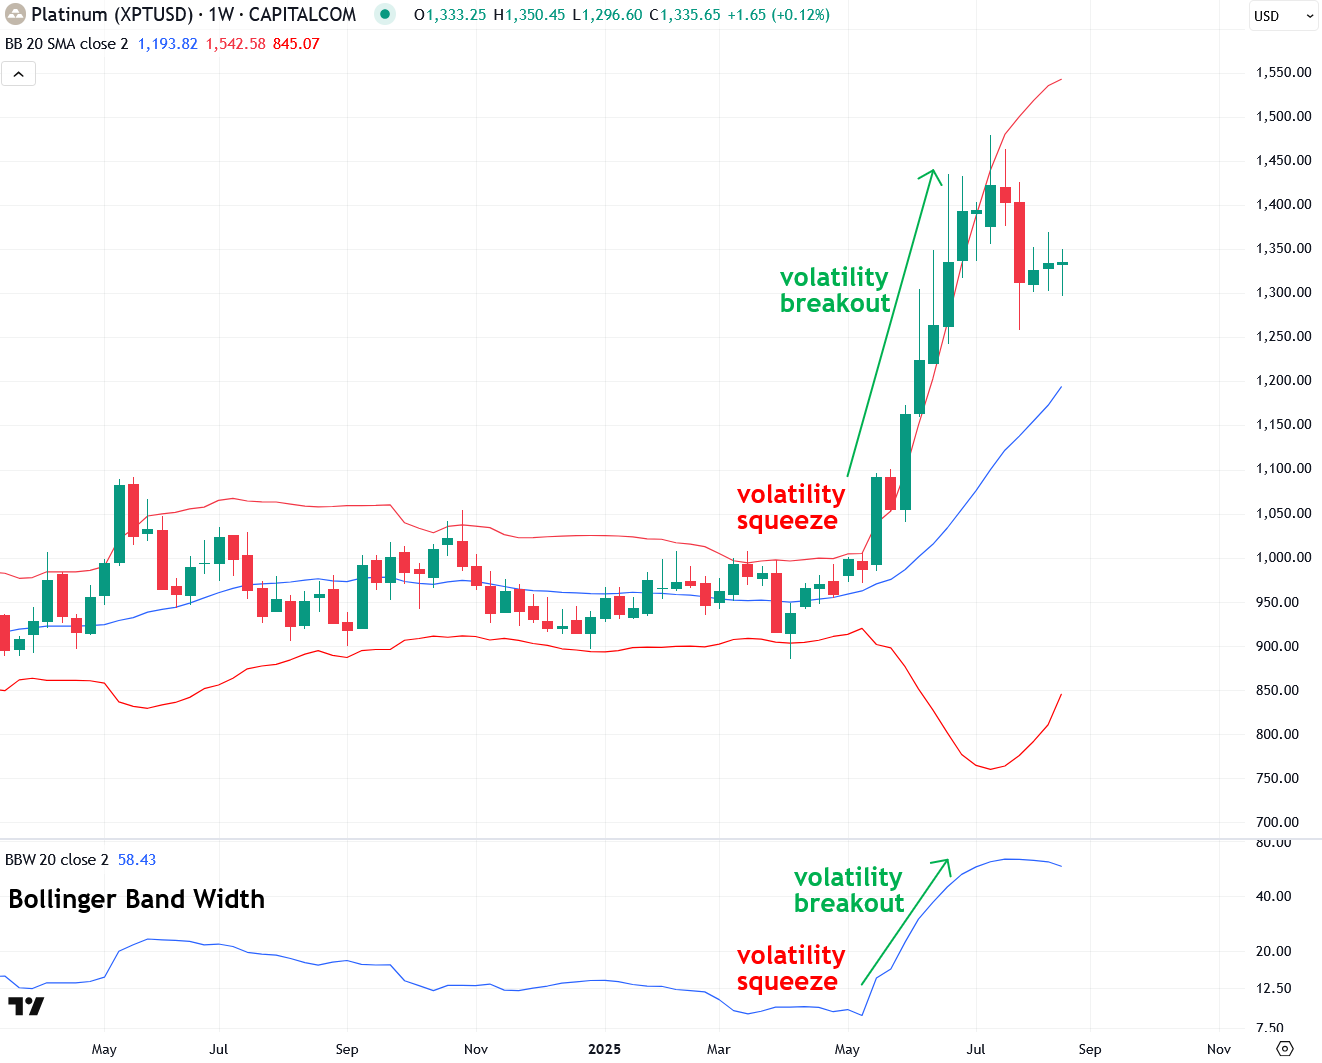
Next, I want to explain the powerful concept of a volatility squeeze using the same platinum chart as above, but zoomed in slightly. As mentioned at the start of this article, volatility is cyclical—periods of low volatility are followed by high volatility, and vice versa.
More specifically, periods of extremely low volatility, known as a volatility squeeze, often precede explosive volatility, known as a volatility breakout. This makes volatility squeezes highly valuable to watch for, as they frequently occur just before large, tradeable moves in either direction. In fact, a high percentage of major bullish and bearish moves in markets are preceded by these squeezes. Volatility squeezes can be thought of as a spring compressed under pressure that snaps back violently once released.
It’s also important to understand investor and trader psychology during volatility squeezes. During these periods the asset drifts sideways within a range, news flow is minimal, and boredom and discouragement set in as traders lose interest and shift their attention to more active markets. It’s often at that very point, when most eyes are elsewhere, that a major catalyst appears and propels the asset out of its volatility squeeze into a strong new trend.
Returning to the platinum example below, from March to May the metal entered a clear volatility squeeze, visible in the narrowing Bollinger Bands and confirmed by the Bollinger Band Width indicator beneath the chart. During this period traders grew bored and shifted their attention to more active markets.
Then, on May 20th, platinum broke out explosively, surging nearly 50 percent over the following two months and sending volatility sharply higher. This is a textbook example of a volatility squeeze, and they occur regularly, yet most traders are unfamiliar with the concept and are often caught off guard by these powerful moves.
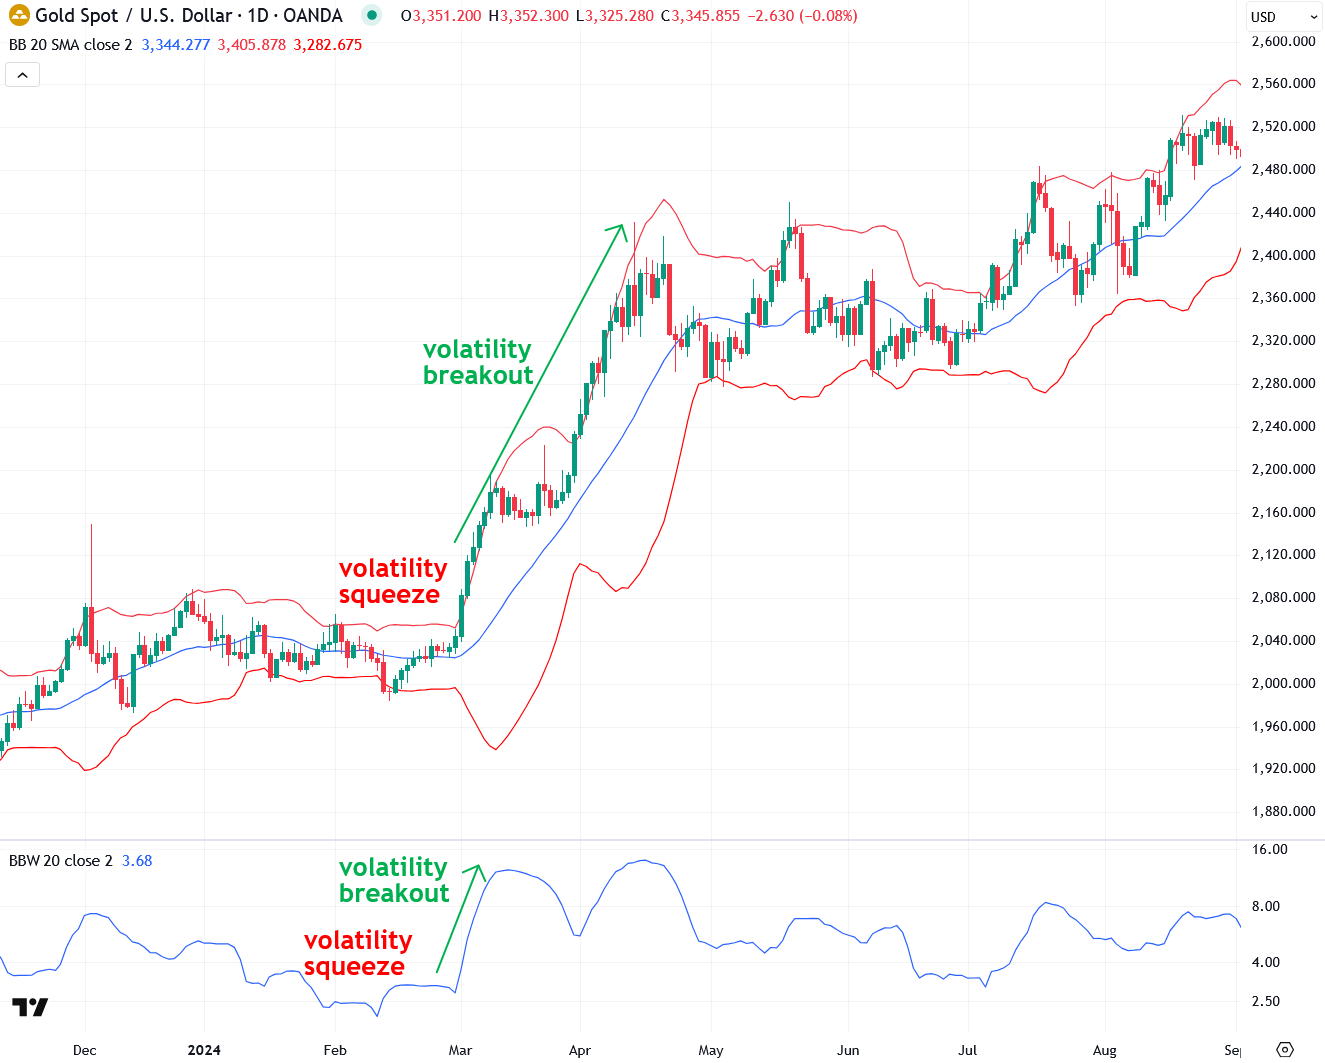
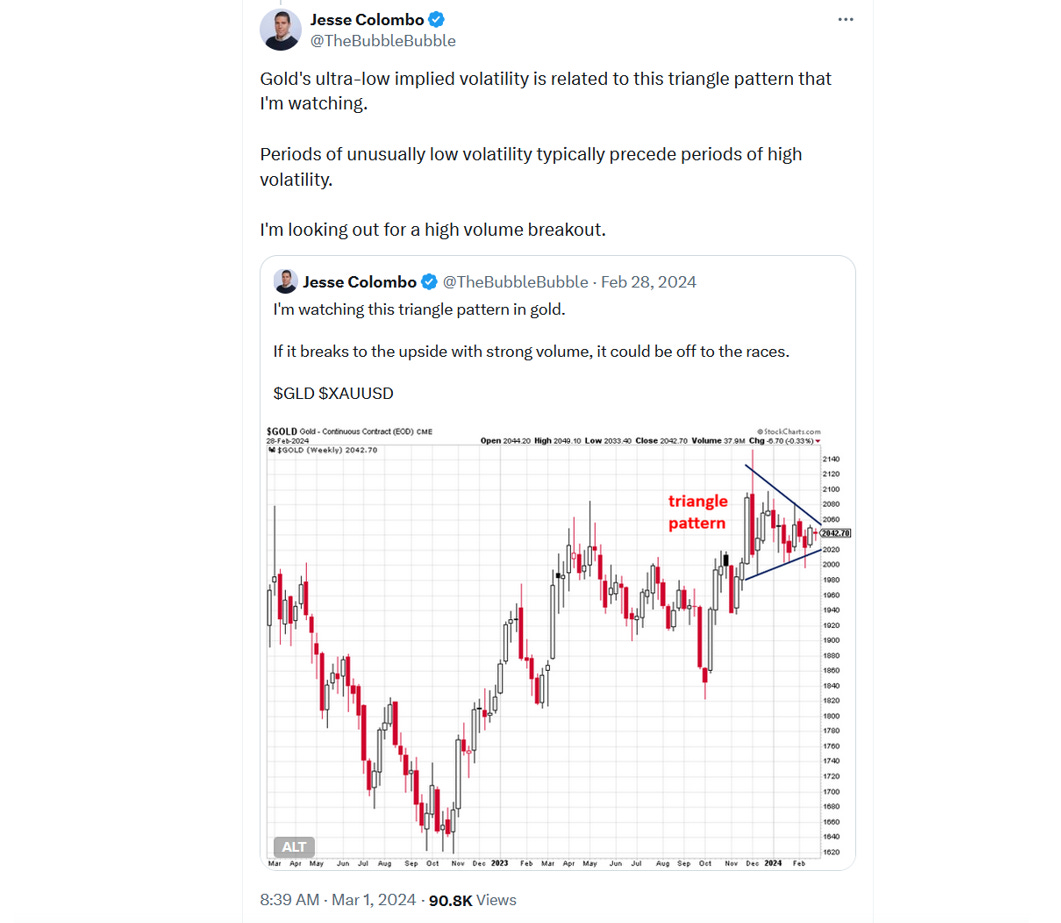
Another prime example of a volatility squeeze was gold in February 2024. Its breakout in March ignited the historic gold bull market that added $1,500 an ounce, and it’s still not over.
In fact, I was well aware of gold’s volatility squeeze in February and March 2024, which helped me become one of the few analysts to call the start of its bull market, as shown in the X post below that received over 90,000 views.
That post went out the very morning gold launched into its rally, and the successful call brought significant publicity, which later helped me launch this newsletter. Within just two months of launching, it became a Substack bestseller. That’s a strong testament to the power of volatility squeezes and the importance of recognizing them!
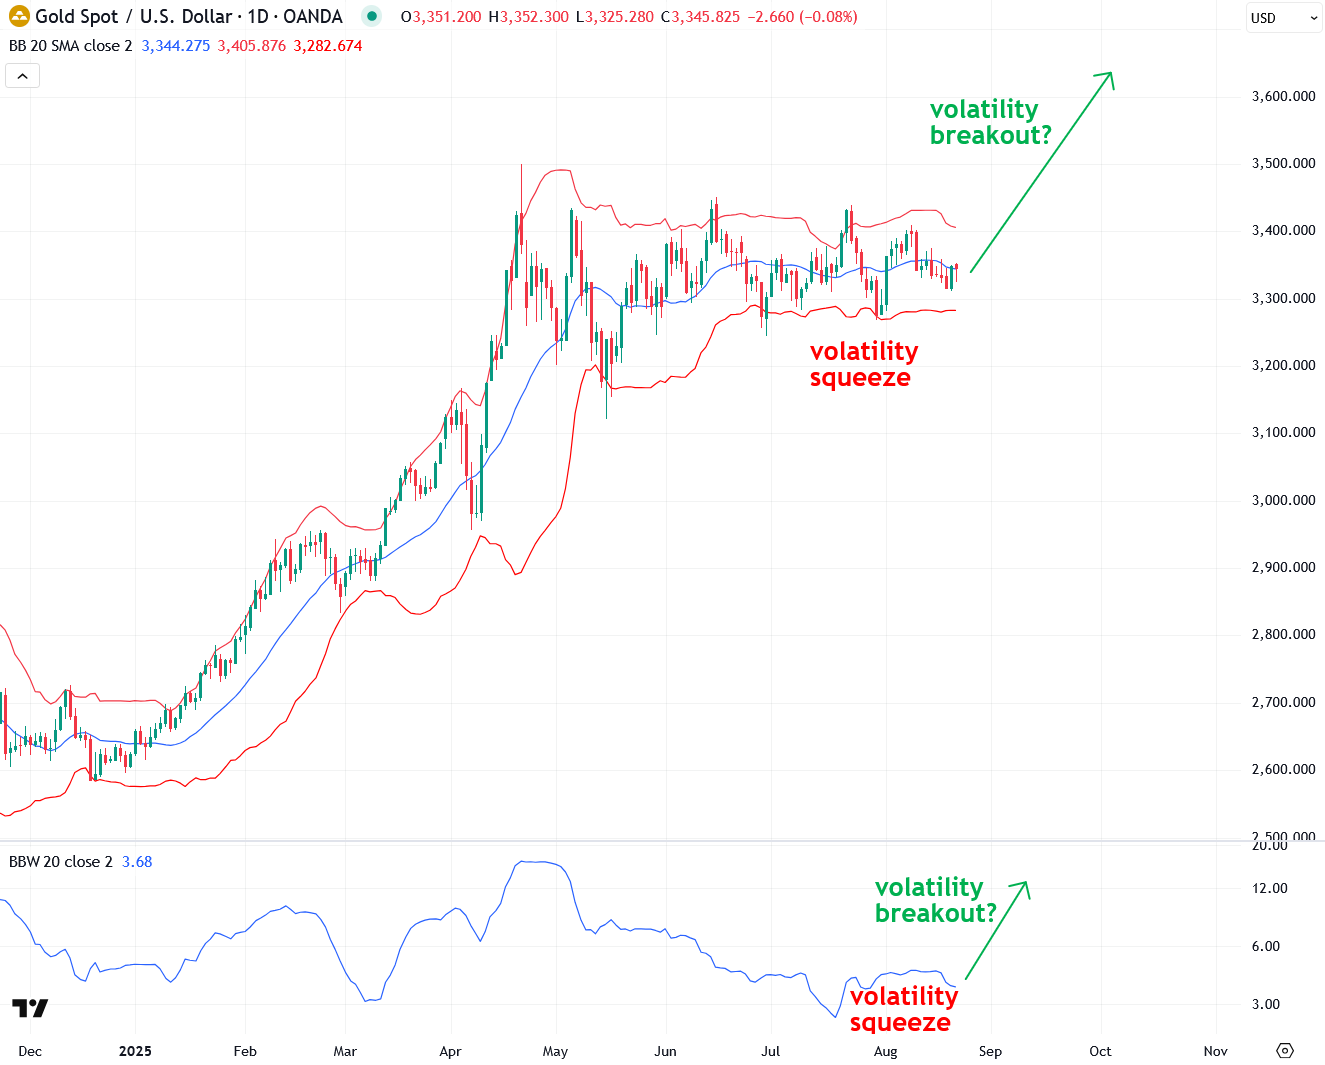
Now that I’ve explained how volatility squeezes work and why they matter, I want to highlight the current squeeze in gold shown in the daily chart below. What may look like “boring” price action since April has actually formed a classic volatility squeeze, visible in the narrowing Bollinger Bands and confirmed by the Bollinger Band Width indicator beneath the chart.
Gold’s current volatility squeeze signals a high probability of a major breakout once the present consolidation ends. Right now it is simply waiting for a catalyst to trigger that move, and I will discuss those potential catalysts shortly.
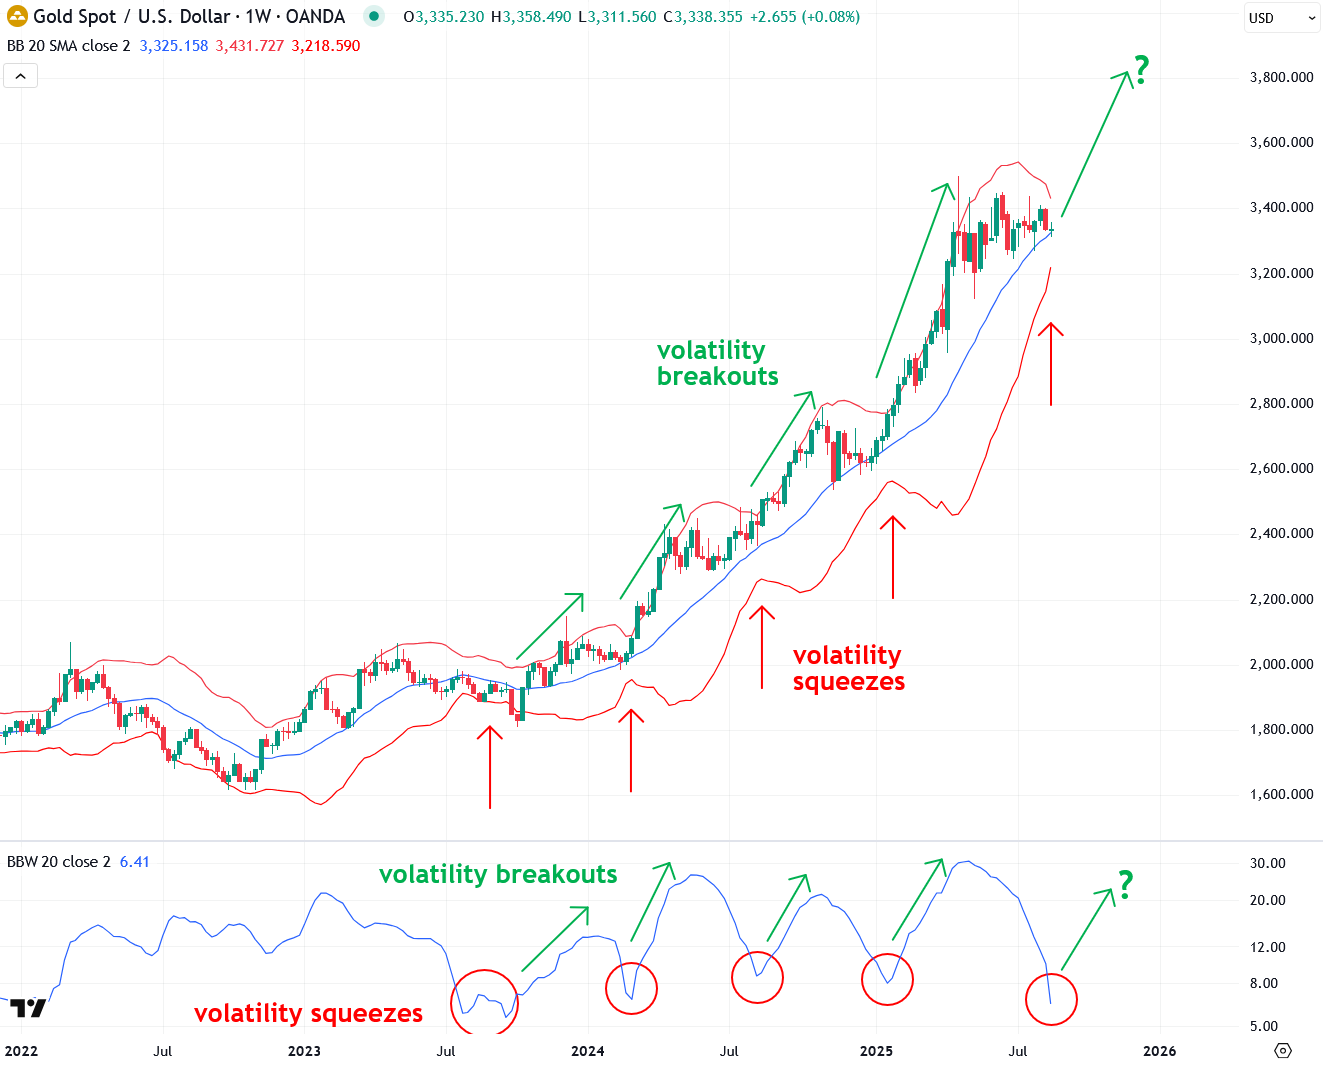
In the next chart I present a weekly view of gold going back to 2022 to highlight how extreme the current volatility squeeze is compared to recent history. It is even more pronounced than the one in February 2024 that launched the bull market, which indicates that the coming breakout could be equally extreme.
The chart also illustrates the cyclical nature of volatility, confirming the lesson at the beginning of this article, and shows how the past 17 months of gold’s bull market have been driven by a repeating pattern of squeezes followed by breakouts. As a major gold bull, I am looking for a continuation of that pattern, and there is a strong probability it will move higher given the prevailing uptrend. However, further confirmation is still needed, which I will discuss next.
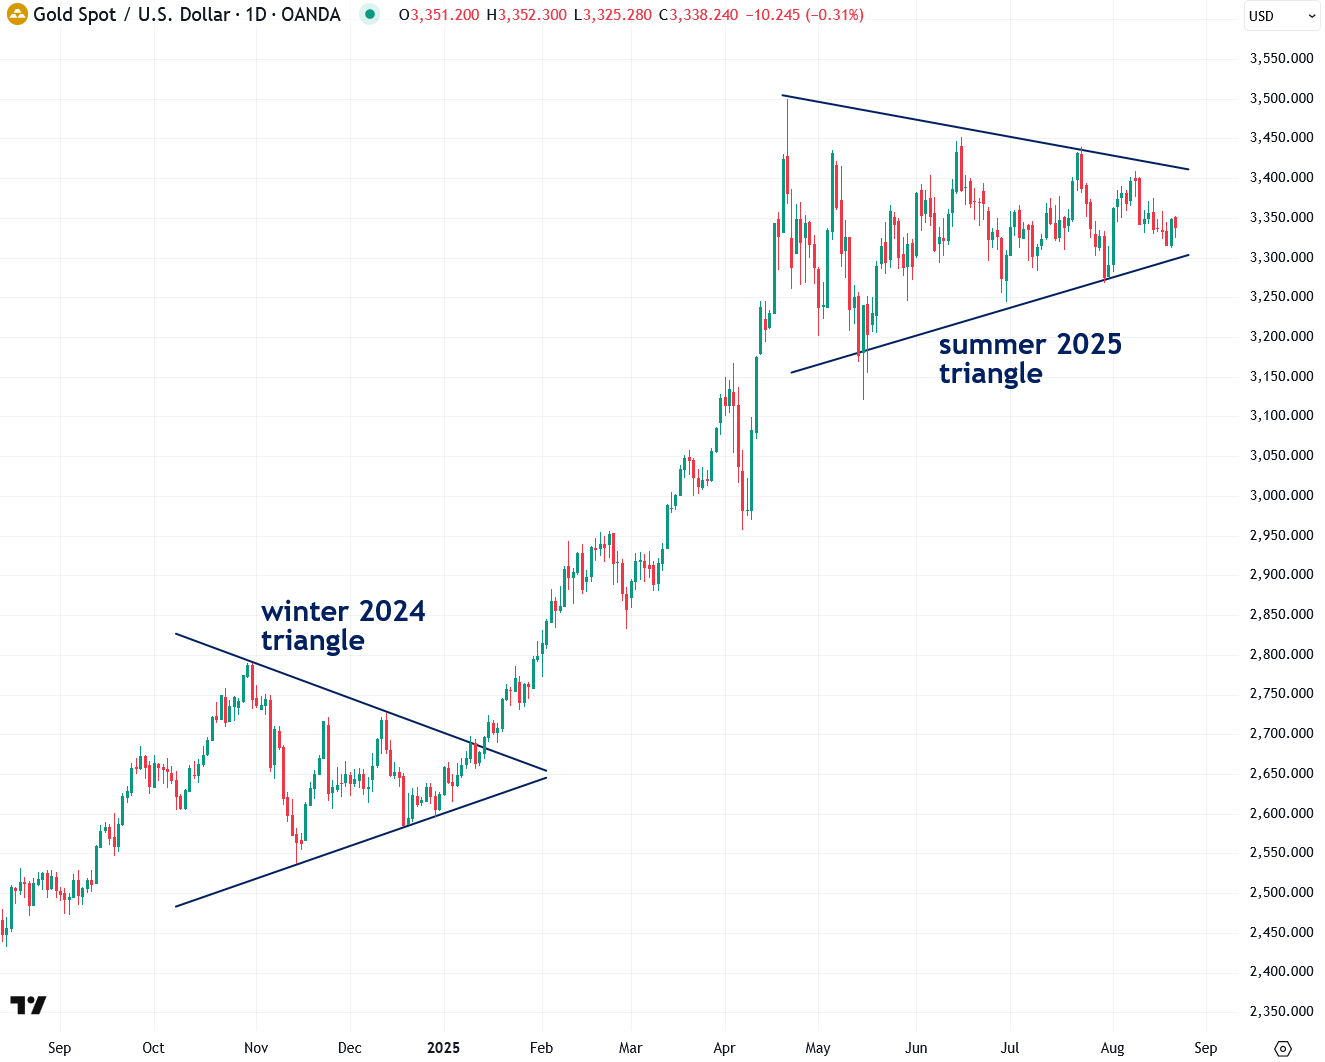
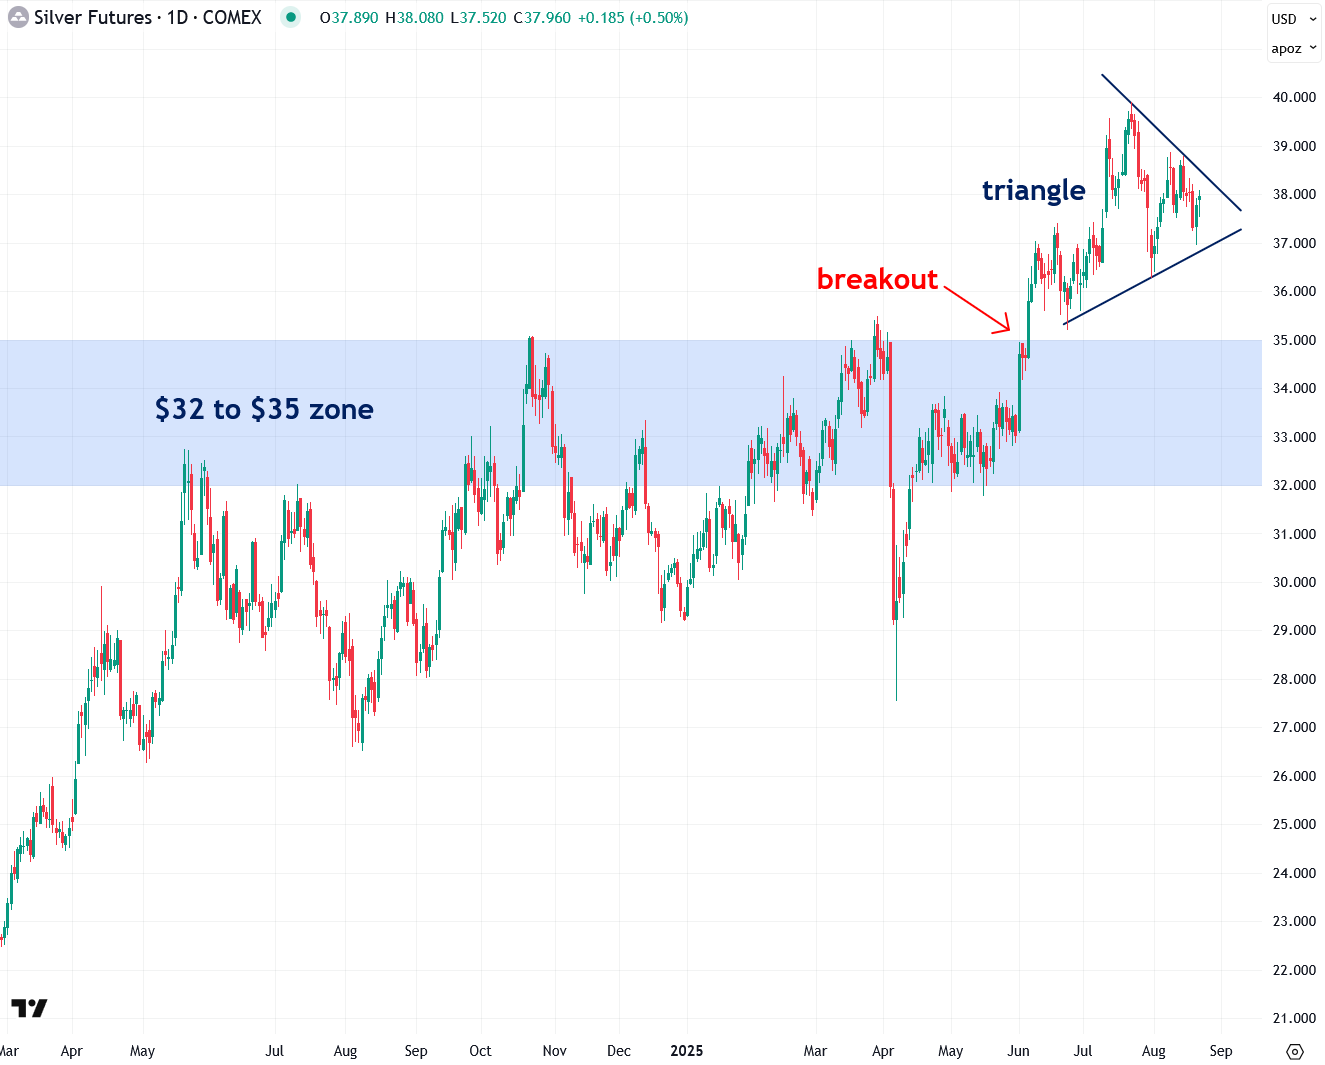
Next, I want to highlight the intersection between gold’s current volatility squeeze and the triangle pattern I have been noting in recent months. Triangle patterns are consolidation phases that form as an asset digests prior gains and trades sideways before often leading to explosive breakouts. Volatility squeezes frequently develop along with these patterns, increasing the likelihood of a major move ahead—and that is exactly the situation gold is in right now.
Read my recent report on gold’s current triangle pattern and why, assuming an upside breakout is confirmed, it points to a price target of around $4,400. You can also read my other report on why JPMorgan and Goldman Sachs expect gold to reach $4,000 by 2026. To learn about gold’s confirmed uptrend, read my recent article on that topic. And for the long-term bullish fundamental case for gold, click here.
While the probability of an upside breakout is much higher than a downside one given gold’s confirmed uptrend, it is still crucial to wait for confirmation in the form of a high-volume bullish breakout from the triangle pattern before considering this thesis valid. Unlike many analysts, I do not make short-term predictions; instead, I take a reactive approach, letting the market reveal its direction and prove itself through decisive price action and volume that signal that the “smart money” are on-board.
Gold’s summer consolidation and volatility squeeze also explains why silver has been quiet despite its breakout above the critical $32 to $35 resistance zone in June. Since gold is a major influence on silver, its sideways action has kept silver subdued.
That said, silver’s breakout remains valid as long as it stays above that zone, which I view as confirmation that its bull market has officially begun (learn more). Gold’s upcoming volatility and triangle breakout will play a major role in determining silver’s next move.
As you may know, I’m an avid book reader and collector and often share recommendations in this newsletter. For those who want to dive deeper into Bollinger Bands, volatility squeezes, and other applications of this powerful indicator, I recommend going straight to the source: Bollinger on Bollinger Bands by John Bollinger, the creator of the indicator himself. It’s one of my favorite trading books and has been immensely valuable in my own learning. You can find it on Amazon here.
Now that I’ve covered the current triangle and volatility squeeze setup in gold, which signals that a major move is likely ahead, I want to turn to several potential catalysts that could trigger it. These catalysts are not mutually exclusive, and the breakout could be driven by a combination of them or even by an unforseen catalyst that I haven’t mentioned.
- The ending of summer and the start of fall
As I noted earlier in this report, financial markets, including precious metals, are usually slow and listless in the summer because much of the financial world is in vacation mode. As a Long Islander, I’m well aware that much of Wall Street heads to the Hamptons or similar retreats for the season.
This results in lighter trading volume and reduced news flow until activity picks up again after Labor Day (September 1 this year) and following the Jewish High Holidays. In 2025, the dates of the High Holidays are Rosh Hashanah (September 22–24) and Yom Kippur (October 1–2).
Last summer, many precious metals traders grew despondent and impatient with gold and silver’s sideways trading, but I explained that a breakout was likely once summer ended. That call proved correct when gold promptly rallied another $400 an ounce in the fall. Now, once again, many are making the same mistake.
- The Fed’s “Jackson Hole” Economic Policy Symposium
Each year in late August, the U.S. Federal Reserve holds its Economic Policy Symposium in Jackson Hole, Wyoming, where Fed leaders, central bankers, economists, and finance ministers gather to discuss major economic issues and provide forward guidance on monetary policy.
Fed Chair Jerome Powell typically delivers a highly anticipated speech at the symposium, offering insights into the central bank’s strategy on issues such as interest rates and inflation. His remarks often shape market expectations for months to come. This year, the event runs from August 21 to 23, with Powell’s keynote speech scheduled for Friday, August 22.
Investors are watching Powell’s comments closely for clues about the Fed’s September policy meeting. A hawkish tone would weigh on both precious metals and stocks, while a dovish stance would support them. Powell is in a difficult position, with President Trump pressuring him to cut interest rates even as inflation remains stubborn. Although the labor market has weakened, wholesale prices in July posted their fastest increase in three years, raising the risk of stagflation.
There is also speculation that Powell will move away from the Fed’s pandemic-era approach, introduced in 2020, that emphasized using interest rate policy to support employment. Under that framework, the Fed cut rates when the job market softened but was slower to raise them when conditions tightened, as in 2021. In addition, the Fed has signaled a return to a more traditional inflation-targeting strategy, aiming directly for 2 percent rather than averaging that level over time. If these shifts take hold, they would represent a hawkish turn, though moreso over the longer run.
- The September FOMC meeting
The Fed’s next interest rate decision is scheduled for September 16–17, and the consensus expectation is a 25 basis point cut. As noted earlier, the Fed’s options are constrained by the growing risk of stagflation, yet its decision—and especially its forward-looking guidance—could serve as a major catalyst for the next big move in precious metals and financial markets more broadly. At last year’s September meeting, the Fed’s aggressive 50 basis point cut triggered strong rallies in both gold and silver.
- Upcoming economic reports
With the growing risk of U.S. stagflation, both the Fed and investors are closely watching economic data, especially reports tied to labor and inflation. Key upcoming inflation releases include Personal Consumption Expenditures (PCE) on August 29, Producer Price Index (PPI) on September 10, and the Consumer Price Index (CPI) on September 11. Important labor reports include JOLTs Job Openings on September 3, the ADP Employment Report on September 4, Nonfarm Payrolls on September 5, and the weekly Initial Jobless Claims, released every Thursday morning.
- The search for the next Fed chair
Jerome Powell’s term as Federal Reserve Chair ends in May 2026, and he has been engaged in a well-publicized dispute with President Trump over interest rates. Trump has repeatedly called for lower rates and believes Powell is keeping them too high in order to undermine him by slowing economic growth—an area Trump takes immense pride in.
The Trump administration is already searching for the next Fed chair, ideally someone dovish and supportive of looser monetary policy. That approach would only worsen the dangerous economic bubbles in stocks and housing, as I will cover in an upcoming report. Potential candidates include National Economic Council Director Kevin Hassett, former Fed board member Kevin Warsh, and current Fed board member Christopher Waller.
The search and confirmation of the next Fed chair is likely to be a major catalyst that could push precious metals out of their current holding pattern and spark a big move. The more dovish the new chair, the more bullish the outlook for gold, silver, and the stock market, since all three tend to thrive under loose monetary policy.
Conclusion
To wrap things up, we reviewed the cyclical nature of volatility, how to measure and monitor it using Bollinger Bands and Bollinger Band Width, and the power of volatility squeezes and breakouts. I then highlighted the current squeeze in gold along with its accompanying triangle pattern, as well as several potential catalysts that could drive a breakout from its summer trading range. For now, it’s a waiting game to see which catalyst triggers the move and when, but with summer ending I believe we are getting close. As I noted, this bullish thesis requires confirmation in the form of a decisive upside breakout on strong volume. I’ll continue monitoring the situation closely and will keep you updated.
If you’ve enjoyed this report or have any questions, comments, or thoughts, please give this post a like and share your thoughts in the comments below—I’d love to start a conversation and hear your perspective.