
Today is a very exciting day because gold and silver have both officially broken out, giving the green light for powerful rallies into year-end. This is the scenario I’ve been long anticipating as summer wrapped up and Wall Street returned from vacation mode. In my last update on Sunday, I explained that gold and silver were beginning to break out, but I was waiting for additional confirmation such as strong COMEX futures volume and breakouts across all major currencies.
That had not happened yet because Friday was right before the three-day Labor Day weekend, when trading volume was subdued, so I wanted to be cautious and wait for follow-through this week. And today, that follow-through arrived in a big way. In this update, I will show you where gold, silver, and the miners stand now, along with my outlook going forward.
Today, gold surged 1.64% to reach another all-time high of $3,533.55, while silver jumped just under 3% to hit a 14-year high of $40.88. While many are pointing to the pullback in U.S. stocks and long-dated Treasuries as the main catalyst for today’s precious metals rally, I believe the move is primarily technical in nature. As I explained a month ago, this breakout was already long in the cards. In my view, gold and silver had been coiling like compressed springs, and now that pressure is being released, they are finally taking off.
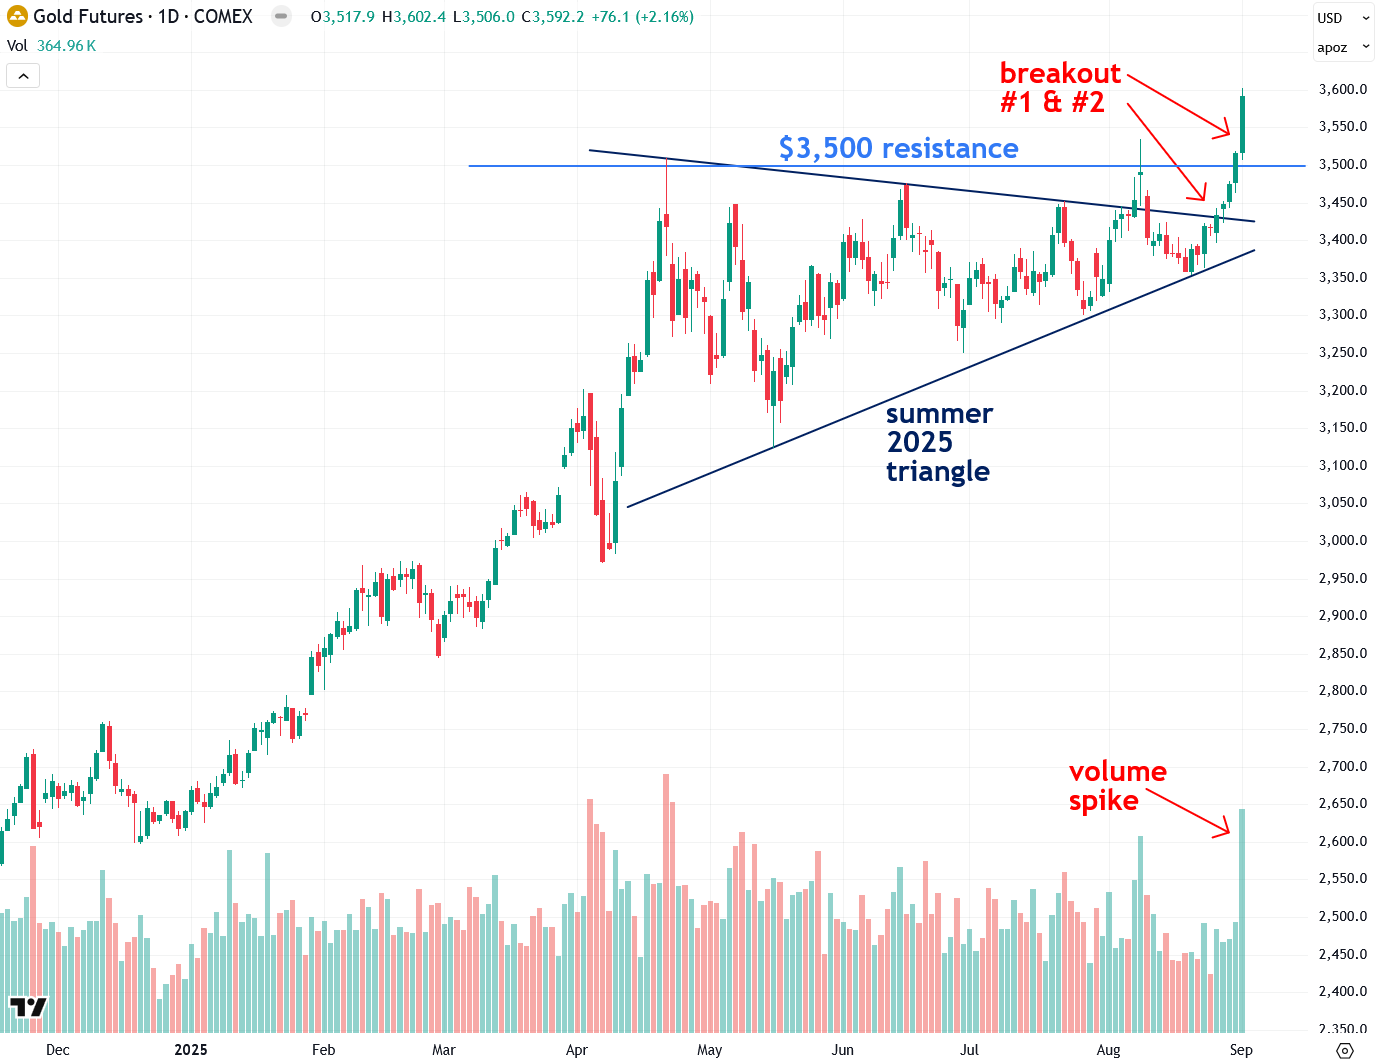
Now let’s take a look at the charts, starting with COMEX gold futures. COMEX gold has officially broken out of its Summer 2025 triangle pattern, as well as above the key $3,500 resistance level I had been watching for additional confirmation. Breakouts above horizontal resistance levels tend to carry more weight than those above diagonal ones, which is why this development is especially significant.
I was also looking for a surge in volume to validate the breakout, and sure enough, we saw that in droves today—a very encouraging sign that the so-called “smart money” is behind this move. With gold’s triangle pattern now decisively broken, there is a high probability that it will rally toward a target of at least $4,400, as I explained in this must-read piece.
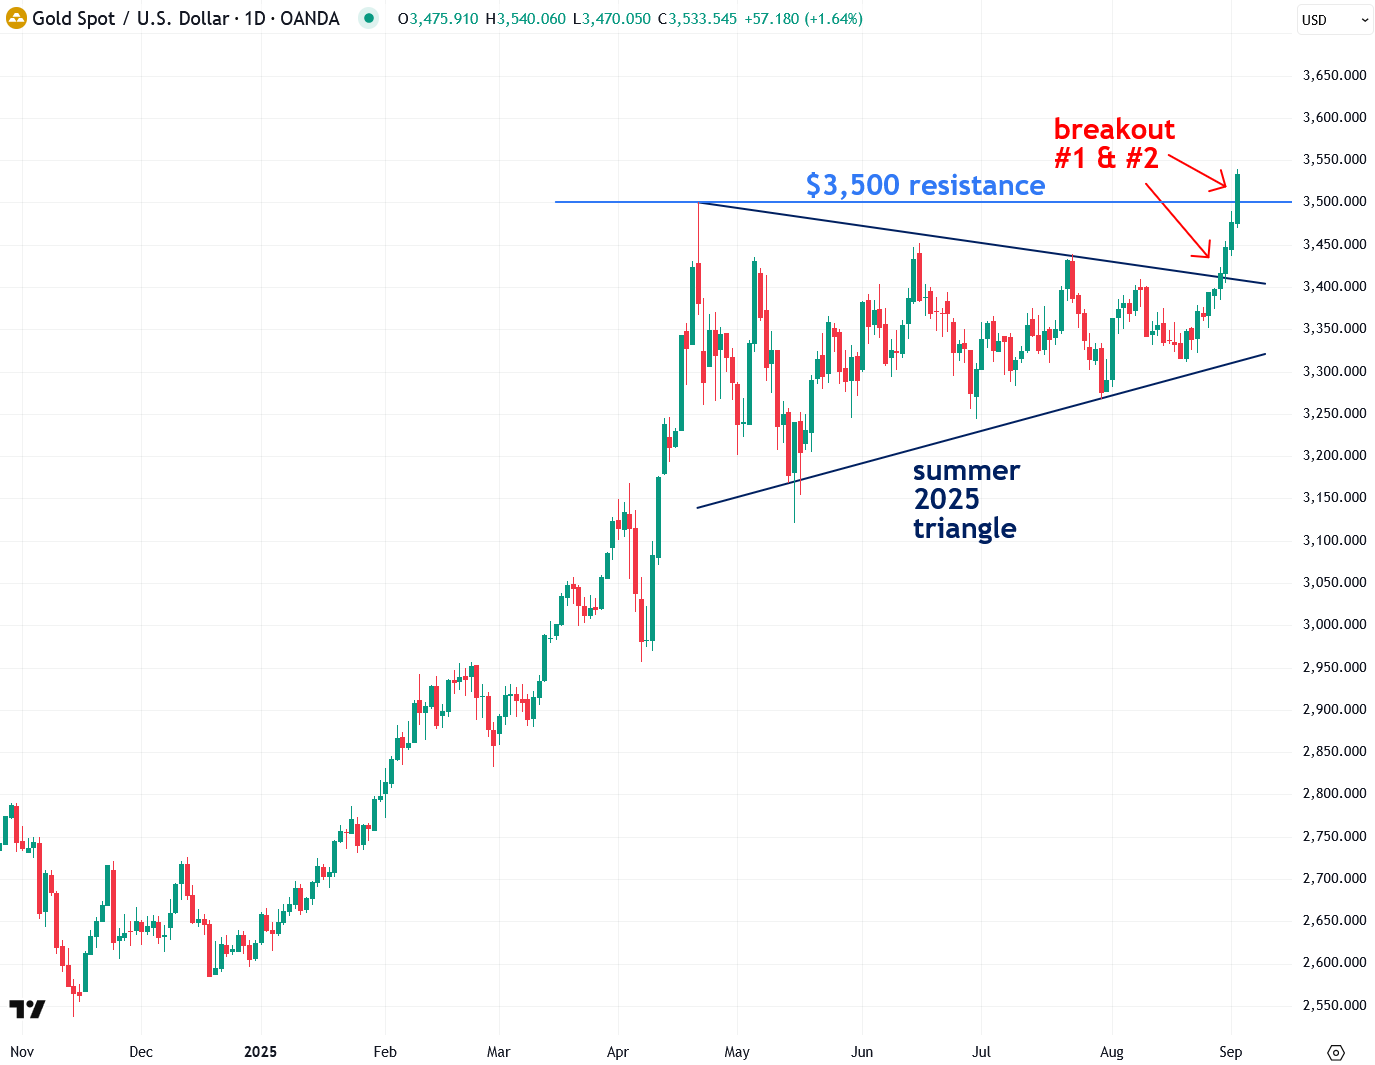
Next, let’s take a look at the spot price of gold in U.S. dollars. Like COMEX gold futures, the spot price has now broken out of its Summer 2025 triangle pattern and above the key $3,500 resistance level, which was the high from April. This is a very encouraging sign.
I had been waiting for both COMEX gold futures and the spot price to break out and send the same message. The two have diverged more than usual lately due to the distorting effects of the Trump administration’s tariff plans and the speculation surrounding them.
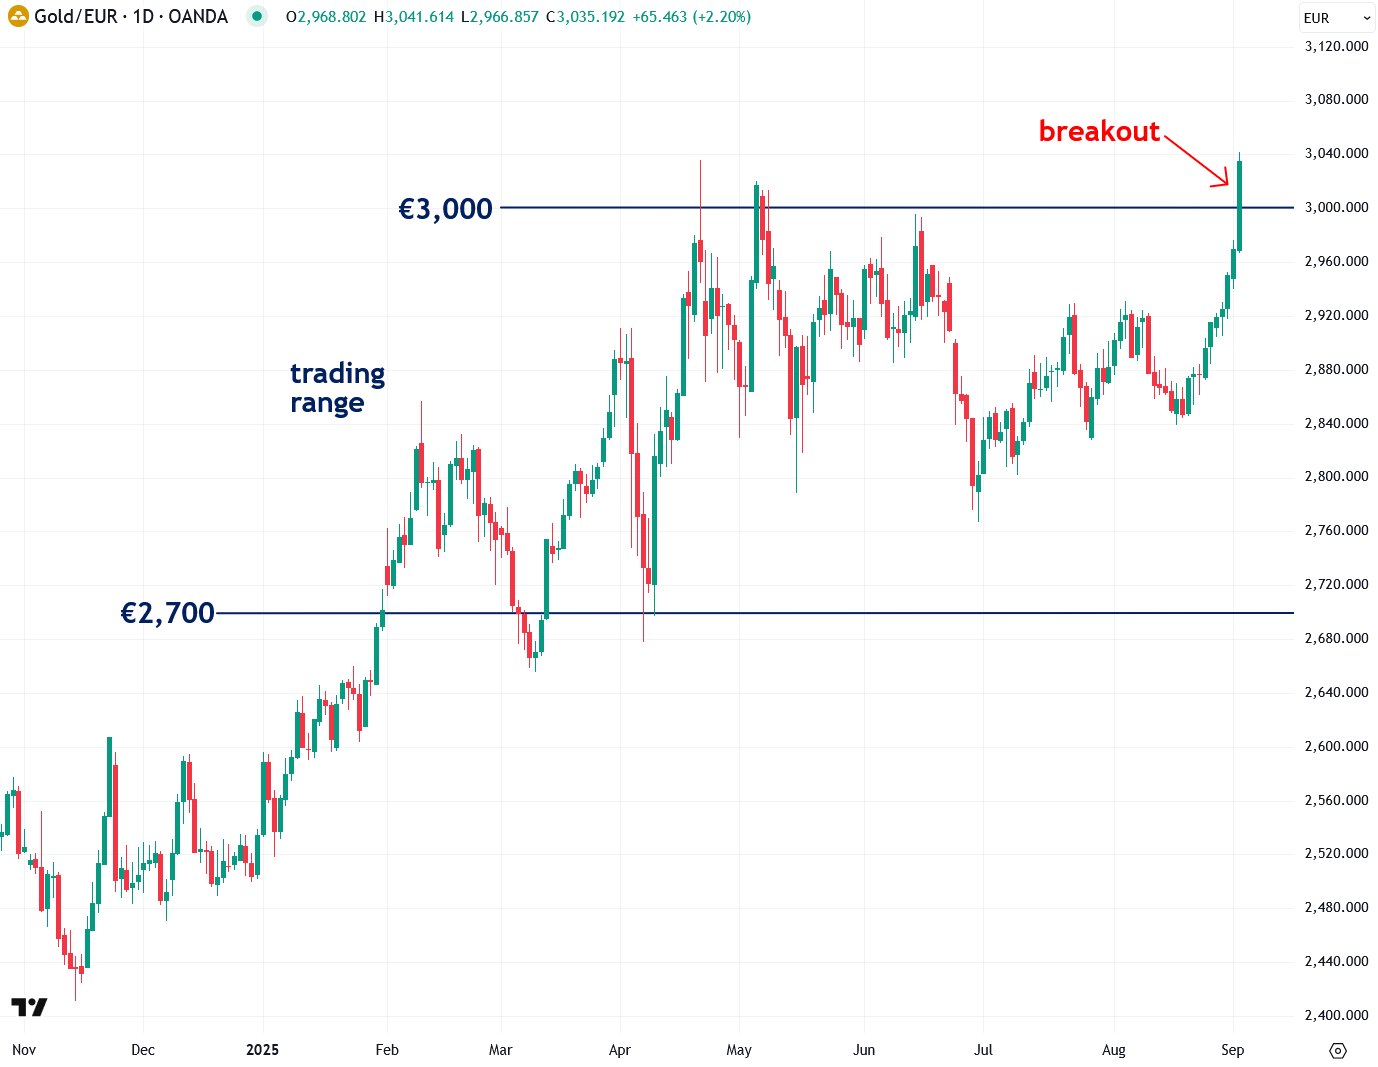
I also monitor gold priced in euros, as it removes the effects of U.S. dollar fluctuations and often gives a clearer picture of how gold is performing in its own right. Since February, gold in euros had been trading in a range between €2,700 and €3,000.
Thankfully, gold priced in euros finally closed above the critical €3,000 resistance level today. This is a very positive development, as it confirms that gold’s bull market is now firing on all cylinders. It shows that gold’s strength is genuine and not simply a result of U.S. dollar weakness.
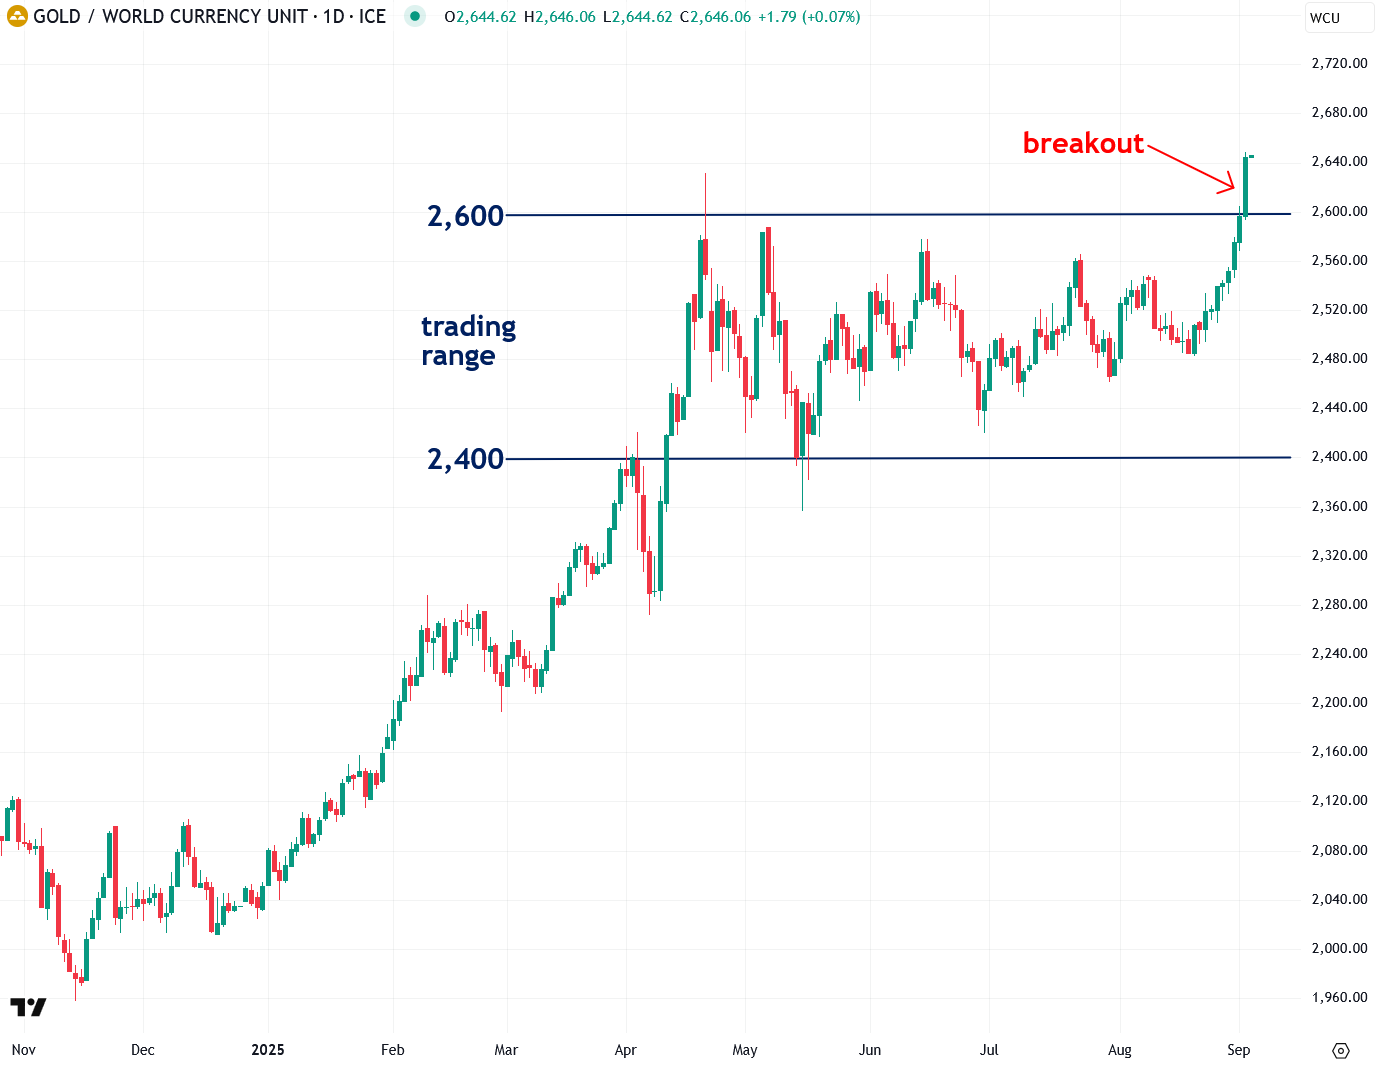
I’ve recently begun tracking gold priced in the World Currency Unit (WCU)—a composite currency based on the GDP-weighted average of the world’s 20 largest economies. In many ways, it offers one of the most balanced and accurate reflections of gold’s true global performance, which is why I’ve been paying close attention to it.
Since its April peak, gold priced in WCU (World Currency Units) had been consolidating within a trading range between 2,400 and 2,600. It finally closed above the 2,600 resistance level today, which is a major sign of strength and confirmation that the summer consolidation is over and that gold’s bull market is resuming.
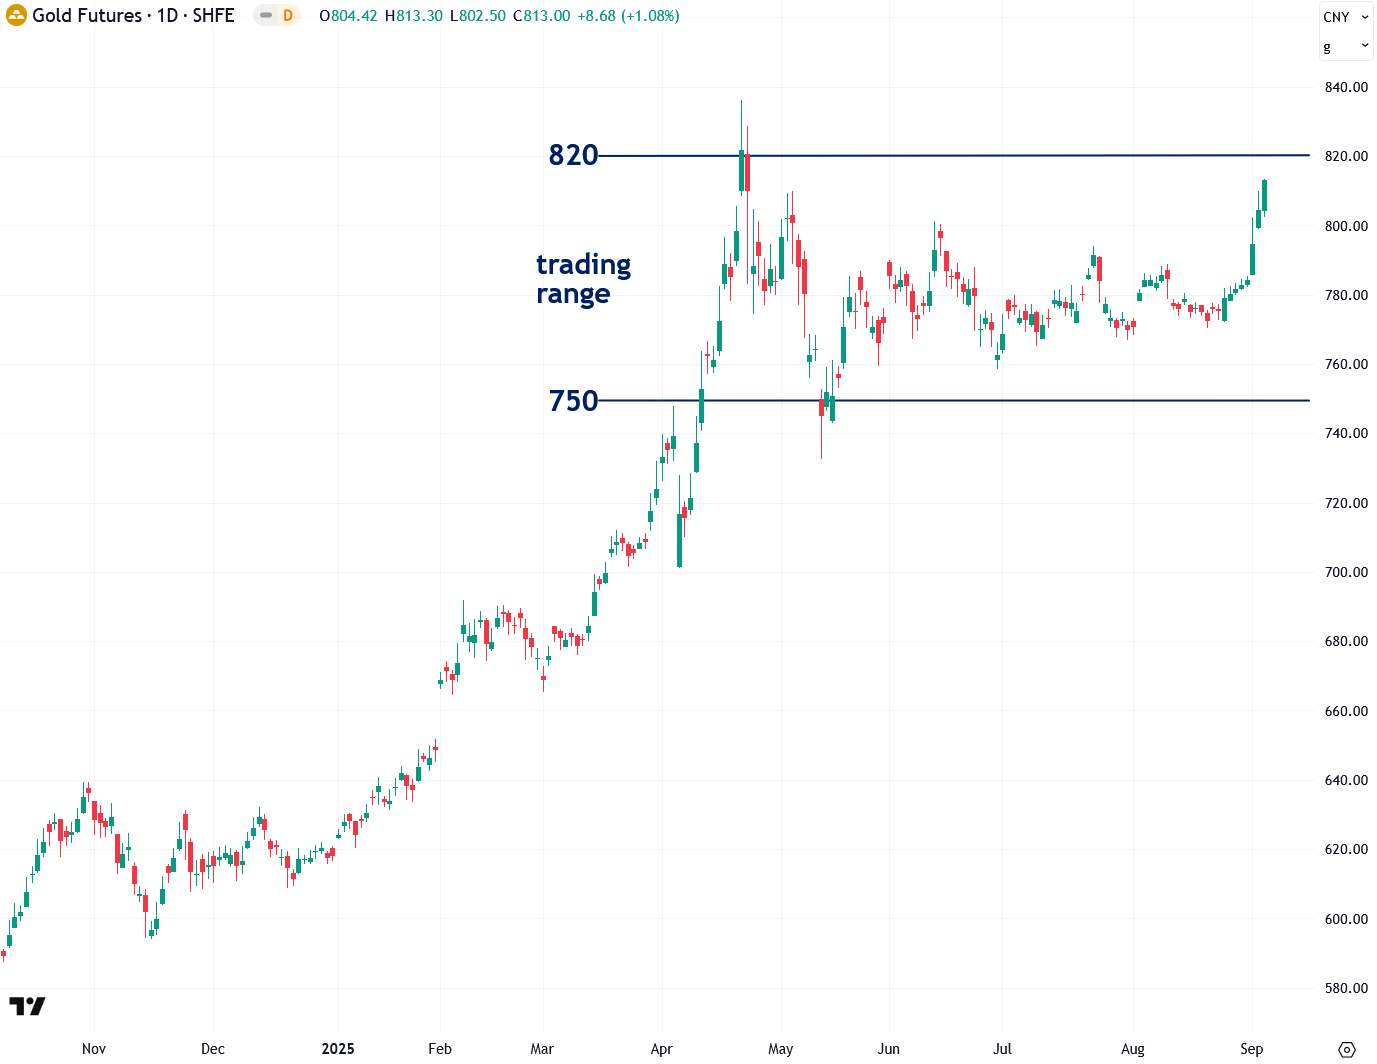
I also monitor Shanghai Futures Exchange (SHFE) gold futures, which have been one of the major drivers of gold’s bull market since early 2024—a topic I’ve often covered in this newsletter. In line with the global gold market, SHFE gold futures have been consolidating within a range of 750 to 820 since April but are now nearing a breakout.
I’m writing this in the evening here in New York, so the Shanghai market hasn’t opened yet. However, it will in a few hours, and when it does, there is a strong chance that SHFE gold futures will surge and finally close above the 820 resistance level. That would be another highly bullish signal.
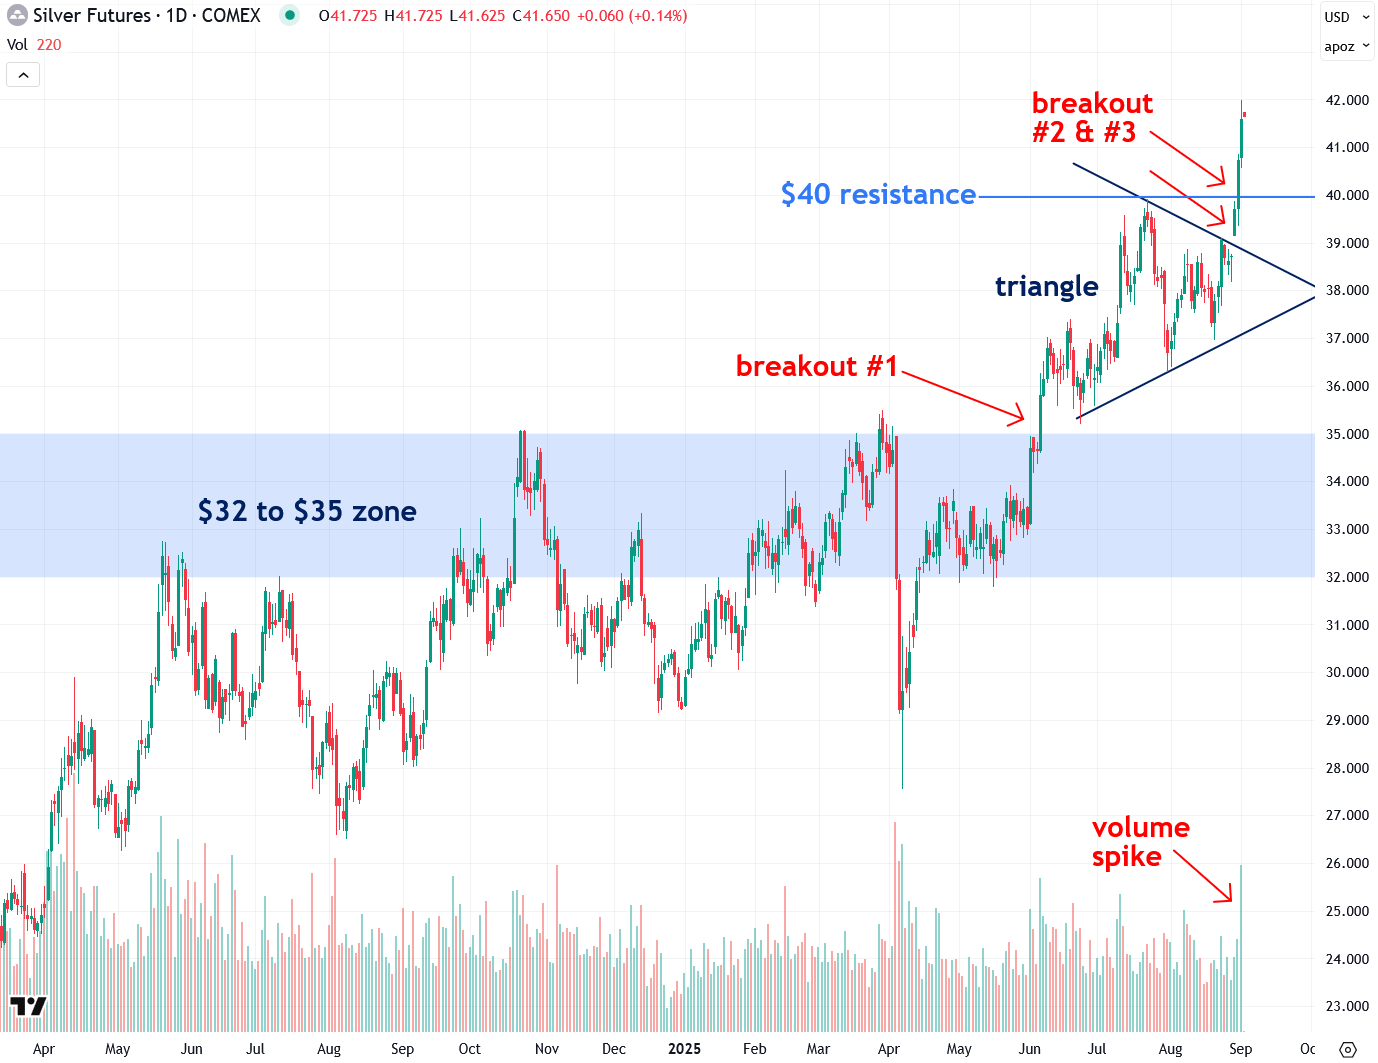
Next, let’s turn to silver, starting with COMEX silver futures. COMEX silver broke out of a triangle pattern last week, which is a very bullish signal, and then pushed above the key $40 resistance level I had been watching. This level marked the late July peak and is especially important because horizontal resistance levels tend to carry more weight than diagonal ones.
I had also been looking for a surge in volume to confirm the breakout and signal that the smart money is backing this rally—and we got exactly that today, which is very encouraging. Right now, all systems are go for silver, and the next stop is $50 and higher, possibly as soon as this month, as I explained yesterday.
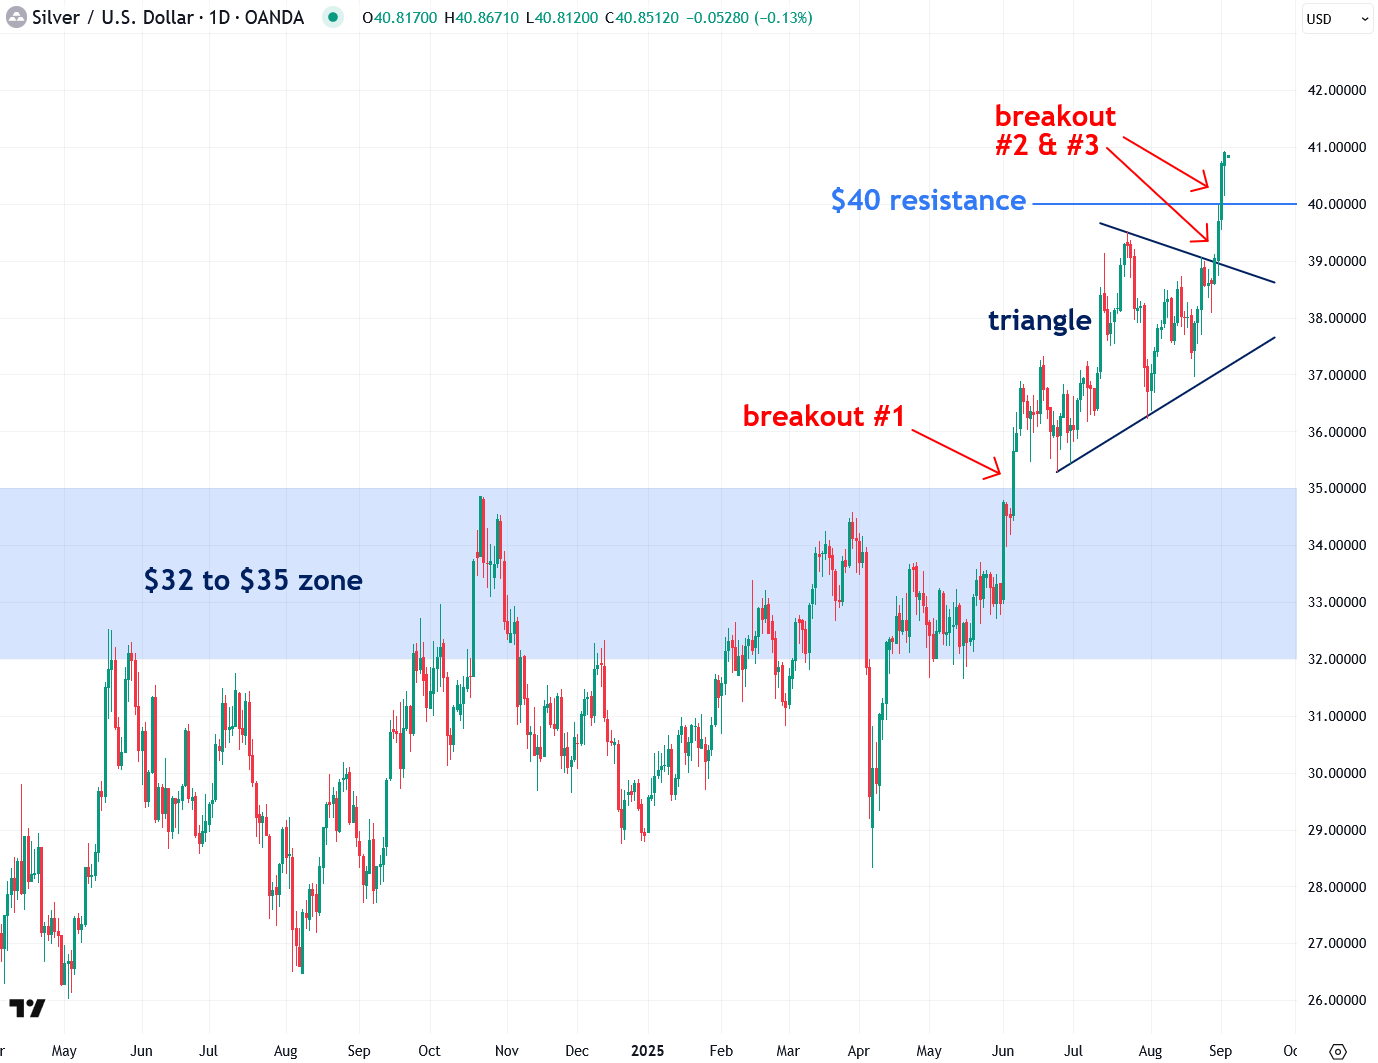
The spot price of silver is also sending the same bullish signal as COMEX silver futures, which is significant because the two had recently diverged in an unusual way due to the distorting effects of the Trump administration’s tariff plans and the speculation surrounding them.
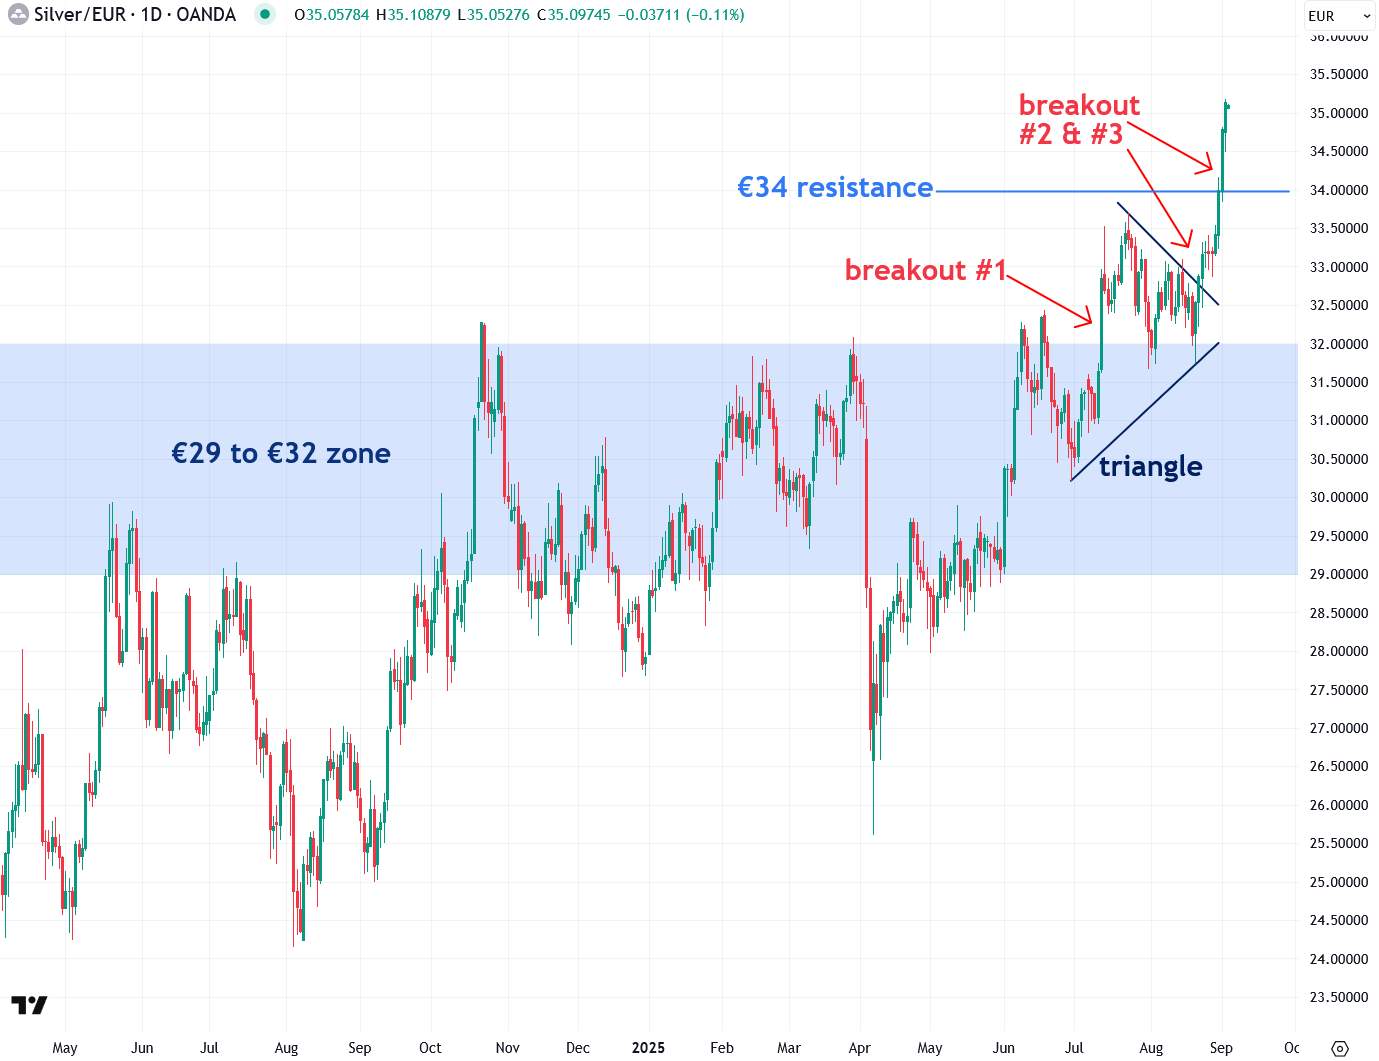
I also monitor silver priced in euros to strip out U.S. dollar fluctuations and gain a clearer view of the metal’s intrinsic strength. This chart is now confirming the same strong signals we’re seeing in dollar-priced silver spot and futures. That is important because it shows silver is truly strengthening on its own and not just rising due to weakness in the dollar.
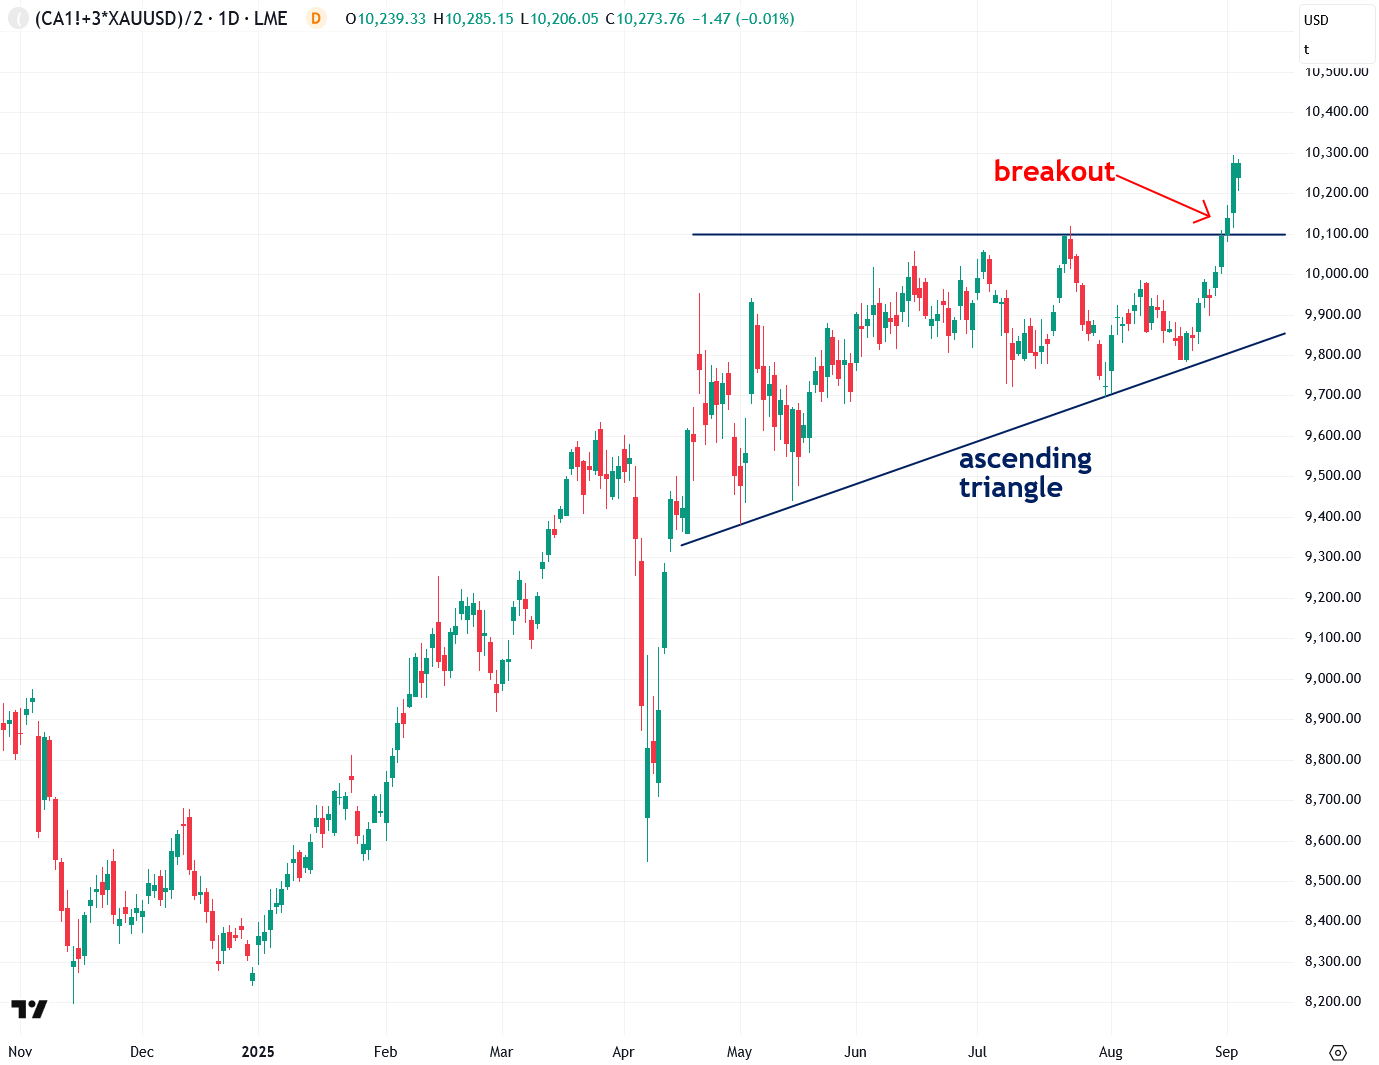
Adding to the excitement is the fact that the Synthetic Silver Price Index (SSPI), a proprietary indicator I developed to confirm whether moves in silver are genuine or simply noise or manipulation, has just broken out of the ascending triangle pattern that has been forming over the past five months. This breakout indicates that both the SSPI and silver are now entering powerful new phases of their bull markets.
Last week I wrote about the major volatility squeeze forming in the SSPI and explained why it was likely signaling a big move in both the SSPI and silver. That move is now clearly underway.
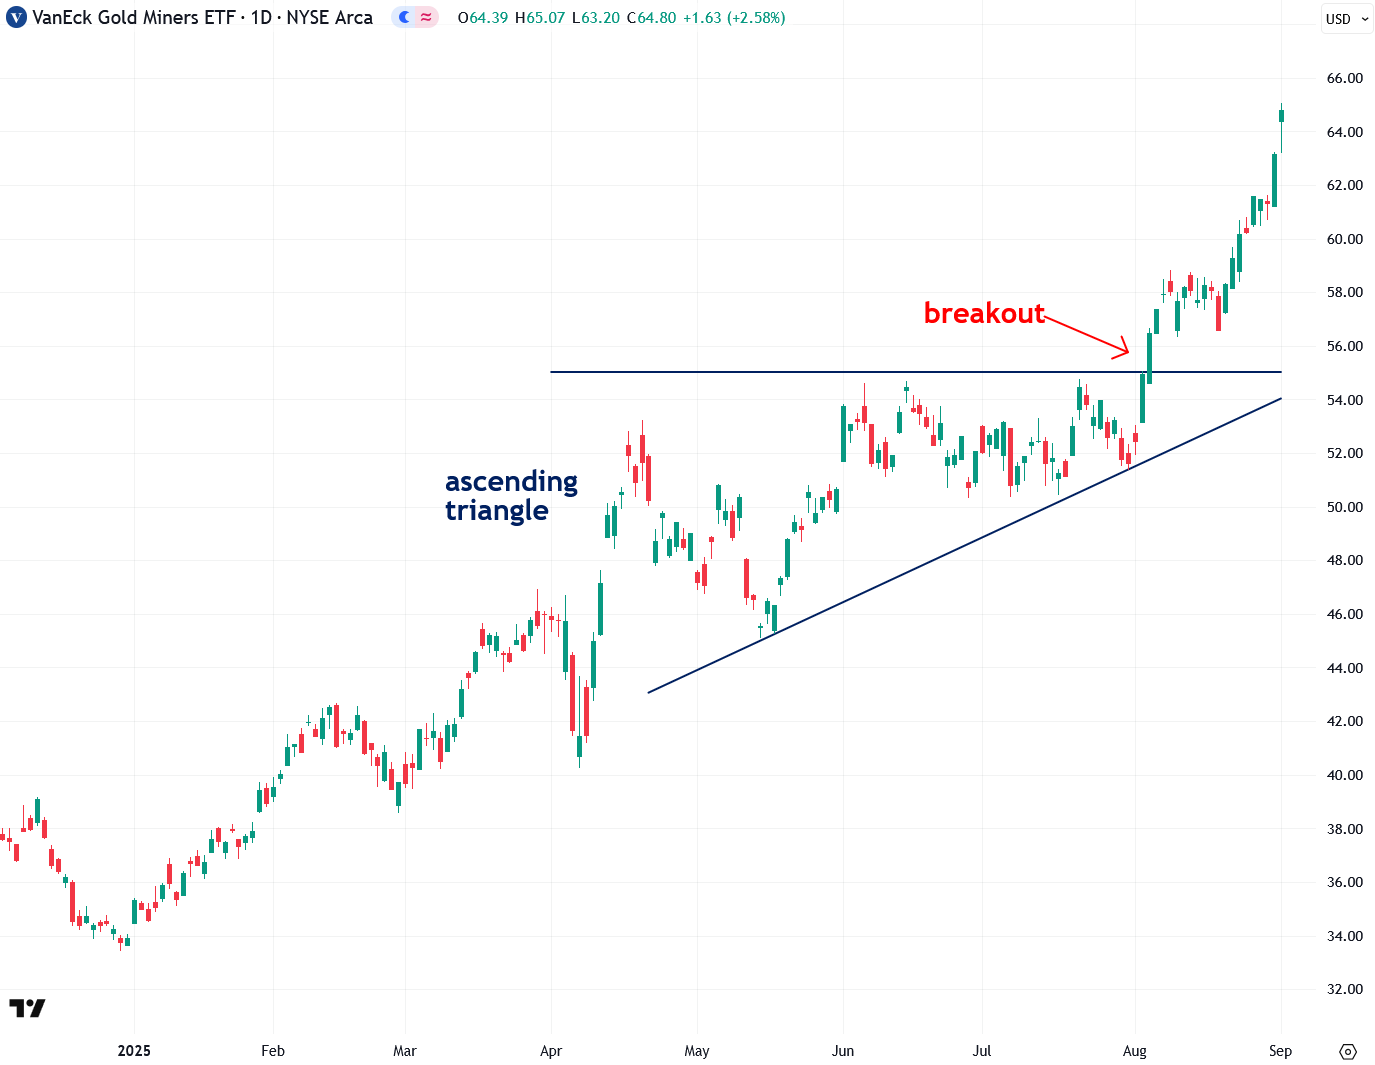
Gold mining stocks, as measured by the VanEck Gold Miners ETF (GDX), continue to gain momentum after breaking out of their ascending triangle earlier this month. With multiple factors now aligning in their favor, I believe we are still in the very early stages of the bull market for gold miners, as I explained in a recent report.
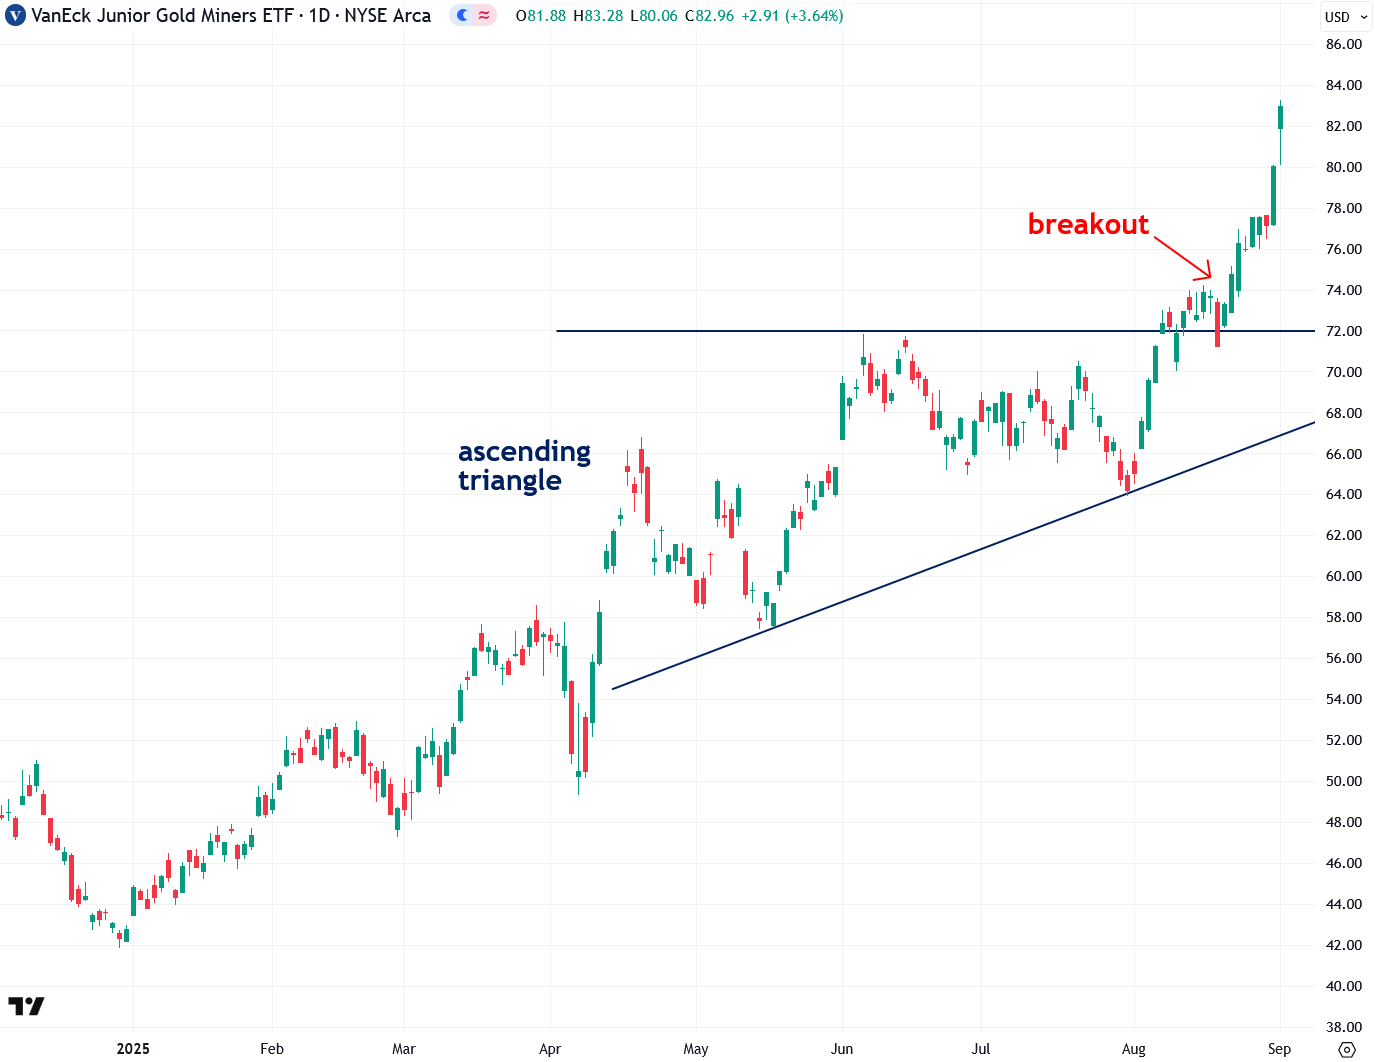
Junior gold miners, as represented by the VanEck Junior Gold Miners ETF (GDXJ), have also broken out of an ascending triangle pattern, adding further confirmation that a major bull market in gold mining stocks is just getting underway.
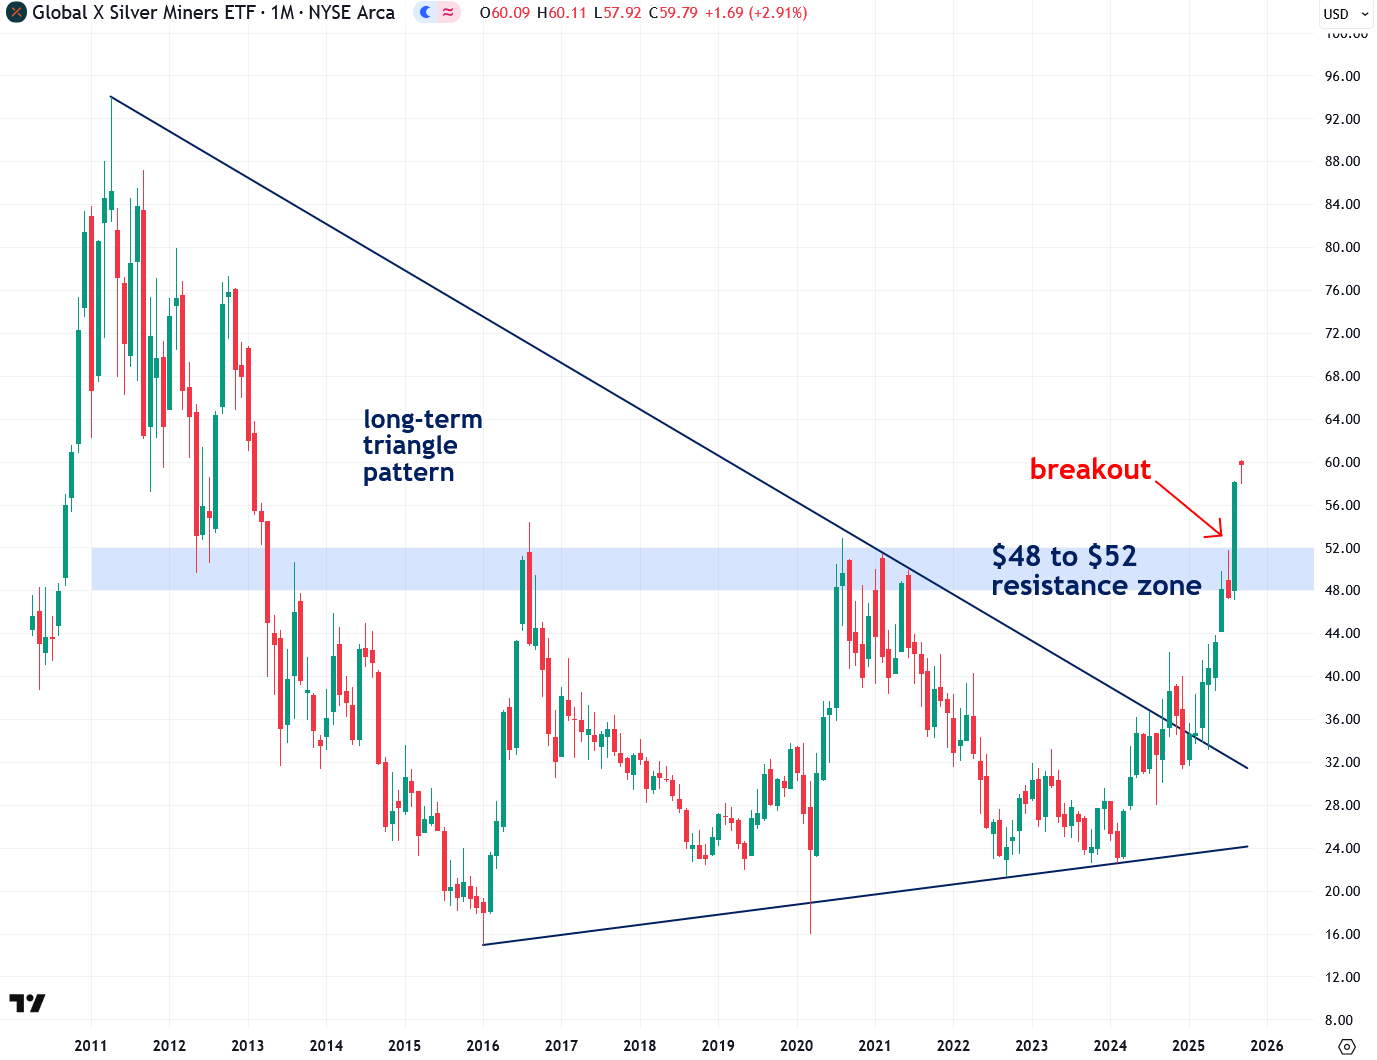
In addition to being bullish on gold mining stocks, I am also very optimistic about silver mining stocks and will be publishing a detailed report on them soon. The monthly chart of the Global X Silver Miners ETF (SIL) shows a decisive breakout above the critical $48 to $52 resistance zone that has capped gains since 2016, which I view as a major bullish signal.
To better understand how support and resistance zones work, check out my two-part educational series (Part 1 and Part 2).
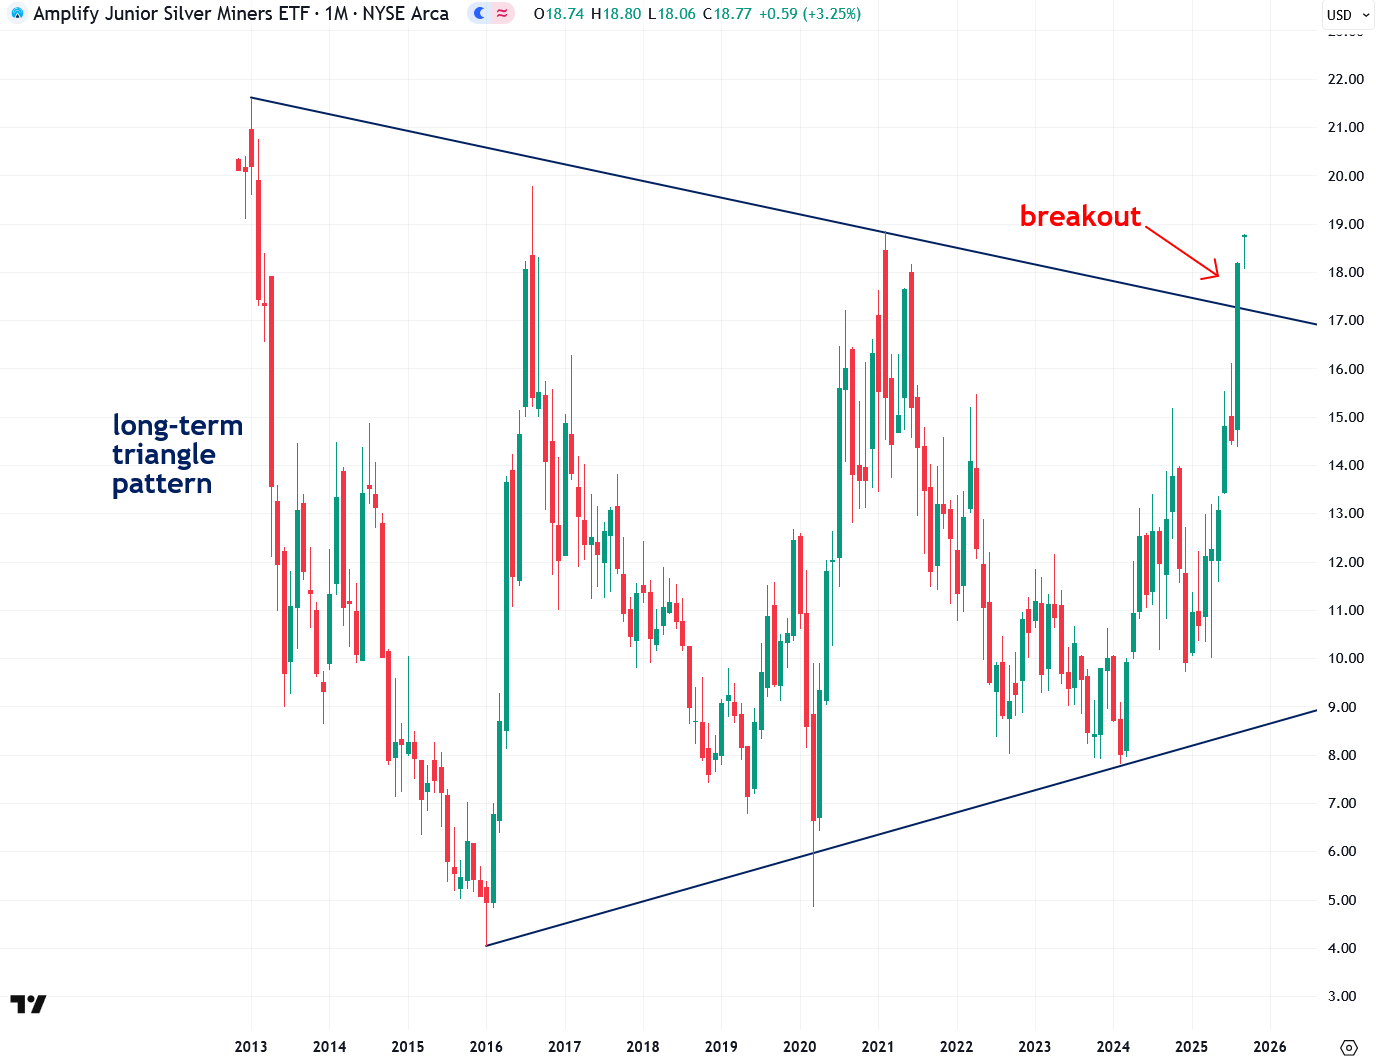
Junior silver mining stocks, which had been lagging until recently, are now waking up in a big way, and I am very bullish on their outlook. The most popular junior silver mining ETF, trading under the symbol SILJ, has now officially broken out of a long-term triangle pattern that dates all the way back to 2013.
Now that this decisive breakout has occurred, I expect explosive upside potential, particularly since junior mining stocks are highly leveraged to the price of the underlying metals and often outperform during broad precious metals bull markets.
To summarize, gold, silver, and mining stocks have now fully broken out of their summer consolidation patterns and are in confirmed uptrends. I expect their rallies to continue at least through the end of this year, with gains likely to be explosive as public awareness and participation increase.
Although gold and silver have already performed exceptionally well over the past eighteen months, I do not believe they are too high or have gotten ahead of themselves. Precious metals bull markets typically last ten to fifteen years, and I expect this one to follow a similar path. It is great to see the stars align and to watch our favorite investments finally surge and begin receiving the recognition they deserve.
This is also a great time to review my recent reports and analyses below, which not only anticipated this precious metals breakout but also offer valuable guidance for what’s ahead:
- Why Silver May Hit $50+ in September
- Copper & Silver Are Setting Up for Powerful Moves
- A Major Move is Ahead For Interest Rates
- Gold’s Volatility Squeeze Signals a Big Move Ahead
- Why Gold May Soon Surge to $4,400
- How Realistic Are Goldman & JPMorgan’s $4,000 Gold Targets?
- Morgan Stanley Expects Further Euro Gains — A Tailwind for Gold?
- The U.S. Dollar is at a Critical Inflection Point
- A Simple Yet Powerful Technique for Identifying Trends
- A Deep Dive into the Long-Term Bullish Case for Gold
- A Comprehensive Bullish Case For Gold Mining Stocks
- Introducing My Favorite Junior Silver Mining Stock
- Silver’s Bull Market Has Officially Begun
- Why I’m Bullish on Platinum
- Gold Isn’t Going Up—Your Money is Just Losing Value
- U.S. and Global Money Supply Surges to Record Highs
- Why I Love Classic U.S. Gold & Silver Coins
If you’ve enjoyed this report or have any questions, comments, or thoughts, please give this post a like and share your thoughts in the comments below—I’d love to start a conversation and hear your perspective.
Disclaimer: the information provided in The Bubble Bubble Report and related content is for informational and educational purposes only and should not be construed as investment, financial, or trading advice. Nothing in this publication constitutes a recommendation, solicitation, or offer to buy or sell any securities, commodities, or financial instruments.
All investments carry risk, and past performance is not indicative of future results. Readers should conduct their own research and consult with a qualified financial advisor before making any investment decisions. The author and publisher disclaim any liability for financial losses or damages incurred as a result of reliance on the information provided.