
Regular readers of this newsletter know that I like to share educational trading and investing tutorials and tips in addition to providing market analyses. I do this to help my valued subscribers become better traders and investors on their own, and also to ensure they can better understand my content, as I frequently apply these techniques. Today, I’m excited to share a powerful lesson on when to buy dips and sell rips across a wide range of assets, including precious metals, commodities, stocks, currencies, cryptocurrencies, and more.
Before diving into today’s lesson, I recommend reading my tutorial on how to identify and trade with the trend, not against it, as well as my recent article on why I don’t worry about assets becoming overbought when they are in strong confirmed uptrends, as is currently the case with gold, silver, and mining stocks.
The core idea behind the technique I explained in those two articles, which I rely on heavily in my own analysis, trading, and throughout this newsletter, is to identify the predominant trend of a market or asset and trade in the direction of that trend, not against it. A trending asset is like a supertanker that takes miles to turn around because of its strong momentum. There is a much higher probability that it will continue moving in the same direction rather than reverse, which is why it is smarter to go with the grain than fight it.
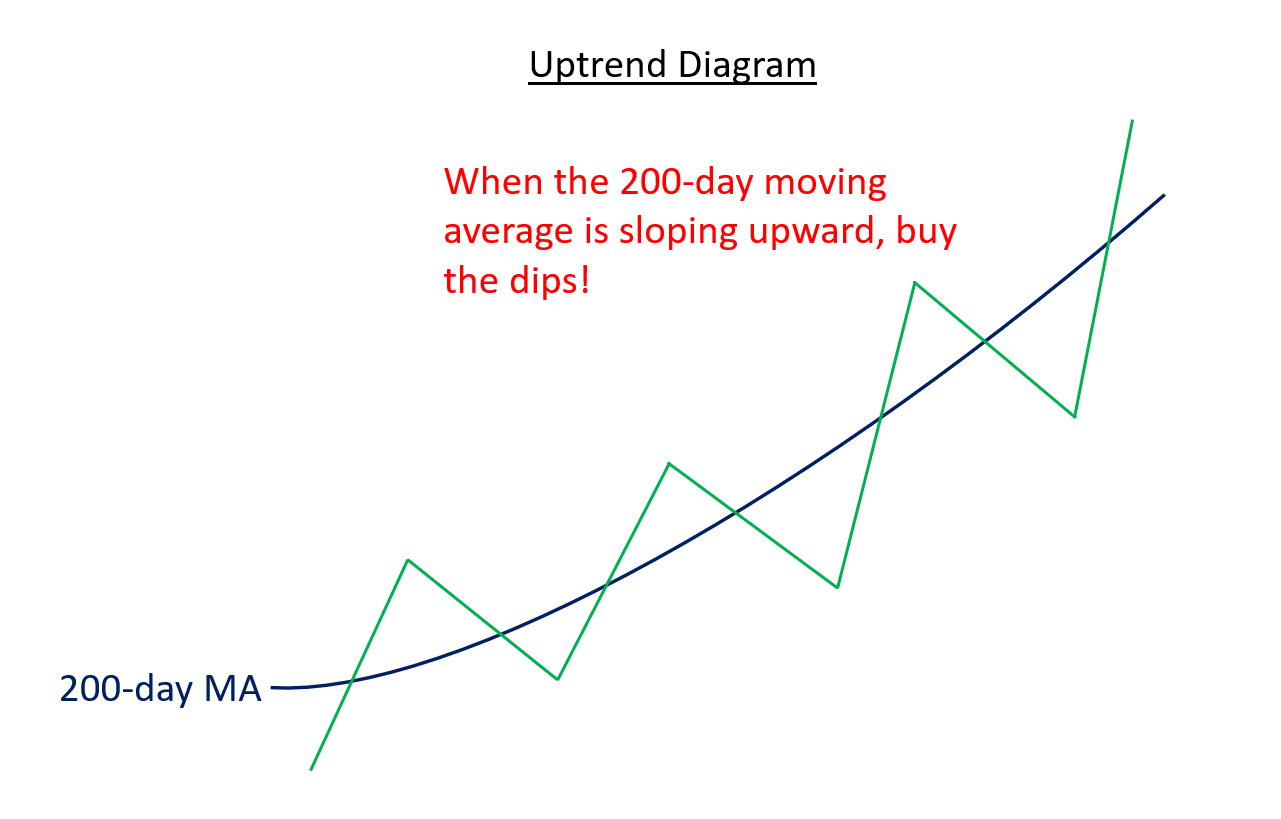
There are several ways to identify the predominant trend, but I prefer the simplest: using the slope of the 200-day (or 200-period) moving average. If it’s sloping upward, the asset is in a confirmed uptrend. If it’s flat, the asset is in a sideways trend. And if it’s sloping downward, the asset is in a downtrend. You can easily check this on almost any charting platform, as most include this basic indicator—even though most traders use it quite differently than I’ve described here.
Now that we’ve established how to identify the predominant trend, I want to introduce another important technical analysis concept: identifying overbought and oversold conditions. An asset is considered overbought when it becomes technically stretched to the upside following a sharp rally. Conversely, an asset is considered oversold when it becomes technically stretched to the downside after a sharp decline. This status is typically measured using momentum-based technical indicators known as oscillators, such as the Relative Strength Index (RSI) or Williams %R.
For the purpose of learning when to buy dips and sell rips, I prefer to use the Williams %R indicator. That’s the indicator you’ll see displayed in all the charts throughout today’s article, positioned just below each asset’s price chart. In this tutorial, I’m using charts from StockCharts.com instead of my usual TradingView charts because, for teaching purposes, I prefer how StockCharts visually highlights the Williams %R indicator. The green and red shading makes it easier to see when an asset is overbought or oversold.
Once the trend of an asset is established, it helps define your trading or investing bias. For example, if an asset is in an uptrend, I focus solely on the bullish case and look for opportunities to maximize gains from long positions. I intentionally ignore negative commentary, such as the current claims from gold skeptics, because it distracts from the broader upward trend. Conversely, when an asset is in a downtrend, I concentrate on the bearish outlook and avoid giving weight to positive news, since it often fails to change the overall direction and is usually followed by further weakness.
With that foundation in place, I’ll now explain how to interpret overbought, neutral, and oversold oscillator readings depending on the type of trend. Each scenario is very different and requires a distinct approach.
- In a confirmed uptrend, the best approach is to “buy the dips” when oscillators show oversold conditions. Overbought readings should be ignored, as they are completely normal during strong uptrends and should actually be welcomed as signs of strength and momentum. That’s why I’m not at all concerned about the current overbought readings in gold and silver, unlike the Chicken Littles who are panicking and calling for a correction.
- In a sideways trend, which I generally prefer to avoid trading, overbought and oversold conditions carry more weight. These signals are more likely to result in quick snapbacks toward the mean, as represented by the 200-day moving average. This environment is where many amateur traders form their habits—reacting to oscillator readings without considering the broader trend. The problem is that this approach does not translate well to strongly trending markets, where those same signals behave very differently.
- Finally, in a confirmed downtrend, the most effective strategy is to “sell the rips” when oscillators signal overbought conditions. Oversold readings should be ignored, as they are completely normal in strong downtrends and actually serve as confirmation of continued bearish momentum. Amateur investors often misread these oversold signals as buying opportunities, only to watch the asset drop even further. This is known as “trying to catch a falling knife.”
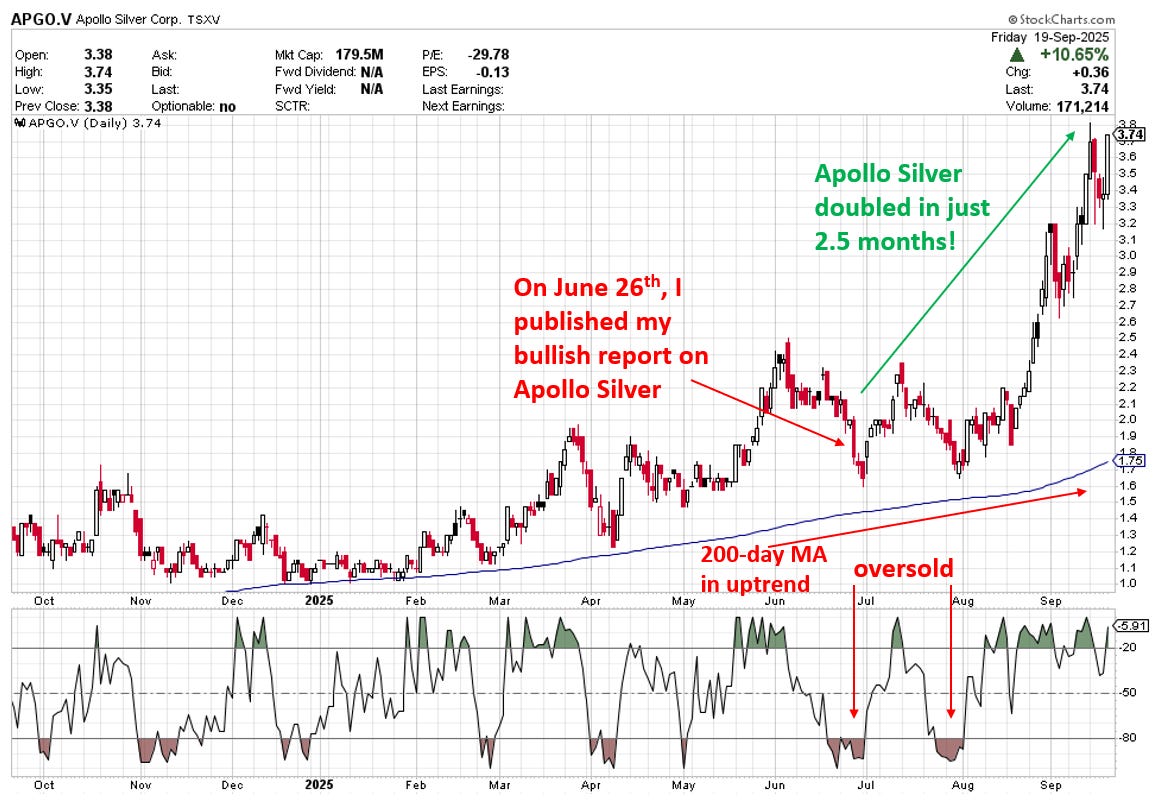
Now I want to show you examples of how to apply this powerful yet simple technique, starting with one I shared in this newsletter two and a half months ago. At that time, I published a bullish report on the junior silver mining stock Apollo Silver, which has since doubled in value. In that report, I explained that while I was fundamentally bullish on Apollo Silver, I also became tactically or short-term bullish because it was oversold within a strong confirmed uptrend, which made a sharp rebound highly likely. As you can see from the chart below, that is exactly what happened. To see my updated thoughts on the stock, read my latest update from Friday.
Let’s take a closer look at what happened with Apollo Silver that led to its dramatic doubling in just two and a half months. First, look at the blue line beneath the price chart, which is the 200-day moving average. Notice that it was, and still is, sloping upward, indicating a confirmed uptrend. In that kind of setup, smart traders align with the trend and not against it.
Also, observe the Williams %R indicator below the chart and how it had become oversold, indicated in red, at the time I published my report in late June. What followed was an initial bounce, then a re-test and another oversold reading, which signaled one final and excellent opportunity to buy the dip. Sure enough, that marked the exact bottom, and the stock doubled from there. This was such a textbook successful trade that I may print out the chart and hang it on my wall!
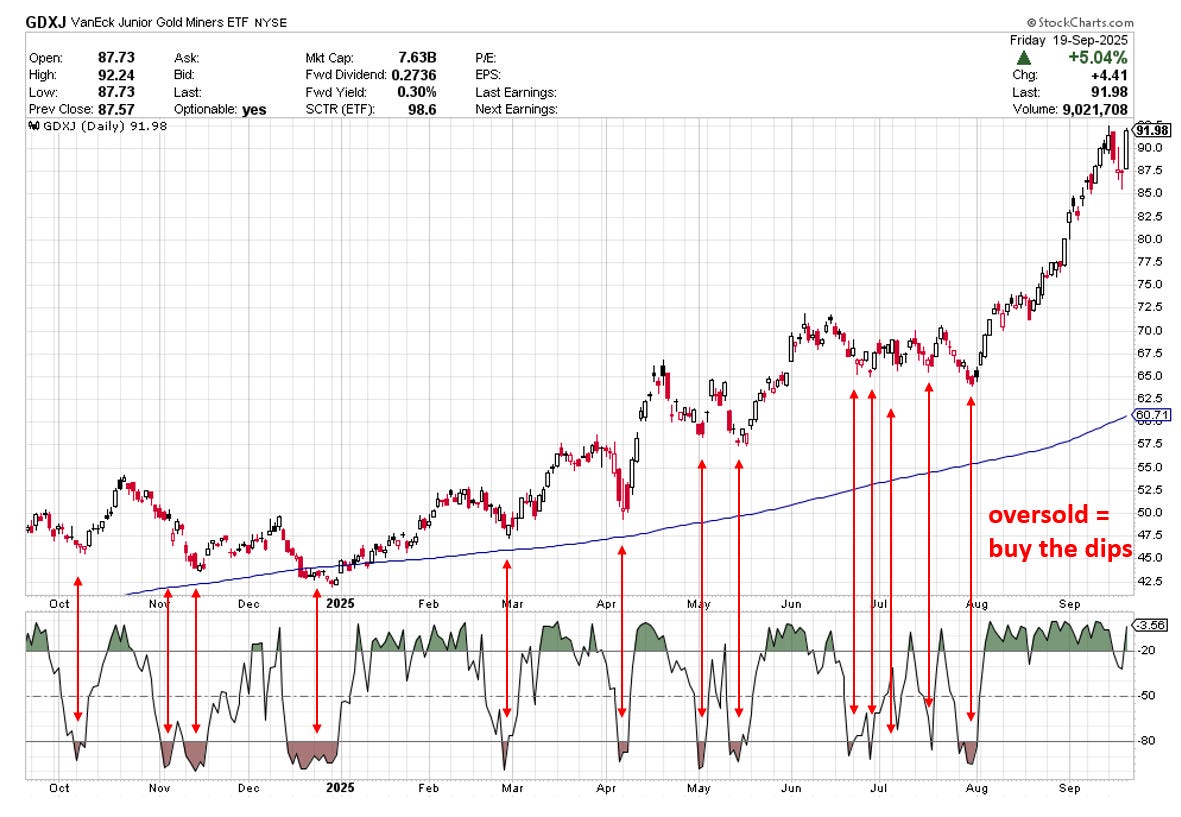
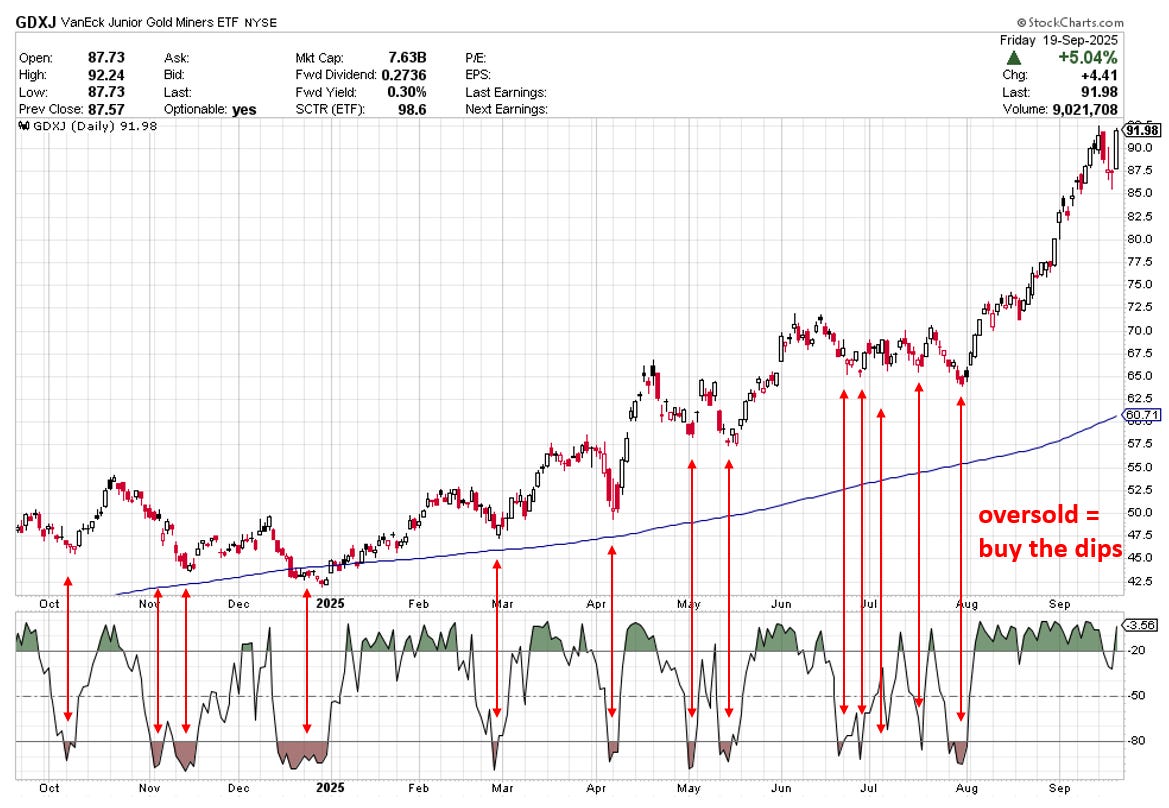
Now let’s move on to other assets, starting with the popular GDXJ junior gold miners ETF. First, take note of the upward slope of the 200-day moving average, which indicates a confirmed uptrend. That tells us to maintain a stance of being ready to buy the dips, as shown when the Williams %R turns red, while ignoring overbought conditions when the Williams %R turns green.
Using this approach, you’ll see that it generated 13 buy signals during the strong rally over the past year, with the vast majority of them marking key bottoms before powerful surges. This clearly shows how effective the method is and why it deserves attention.
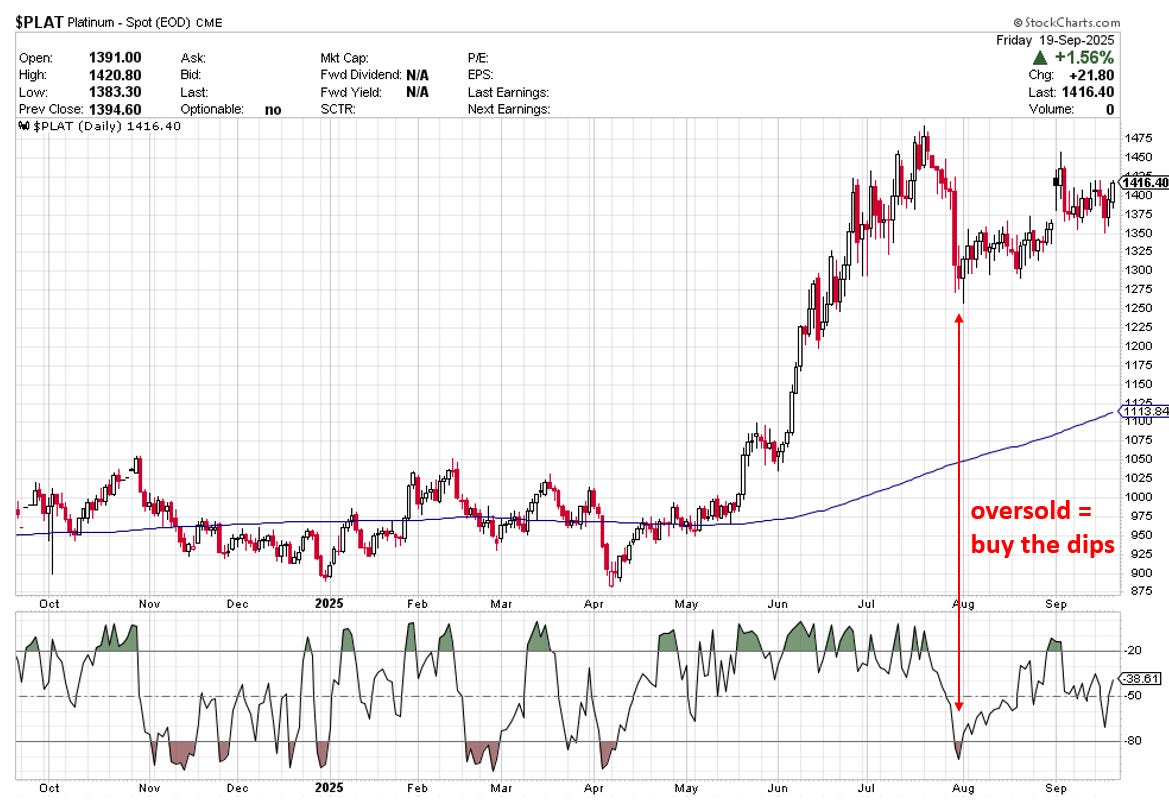
Now let’s look at how this method played out in platinum, which entered a confirmed uptrend in June based on the upward slope of the 200-day moving average. The first dip occurred about a month later, in late July, and triggered an oversold reading on the Williams %R. That proved to be a good time to buy, as platinum rebounded from that level and is likely to continue moving higher once its current consolidation phase is complete.
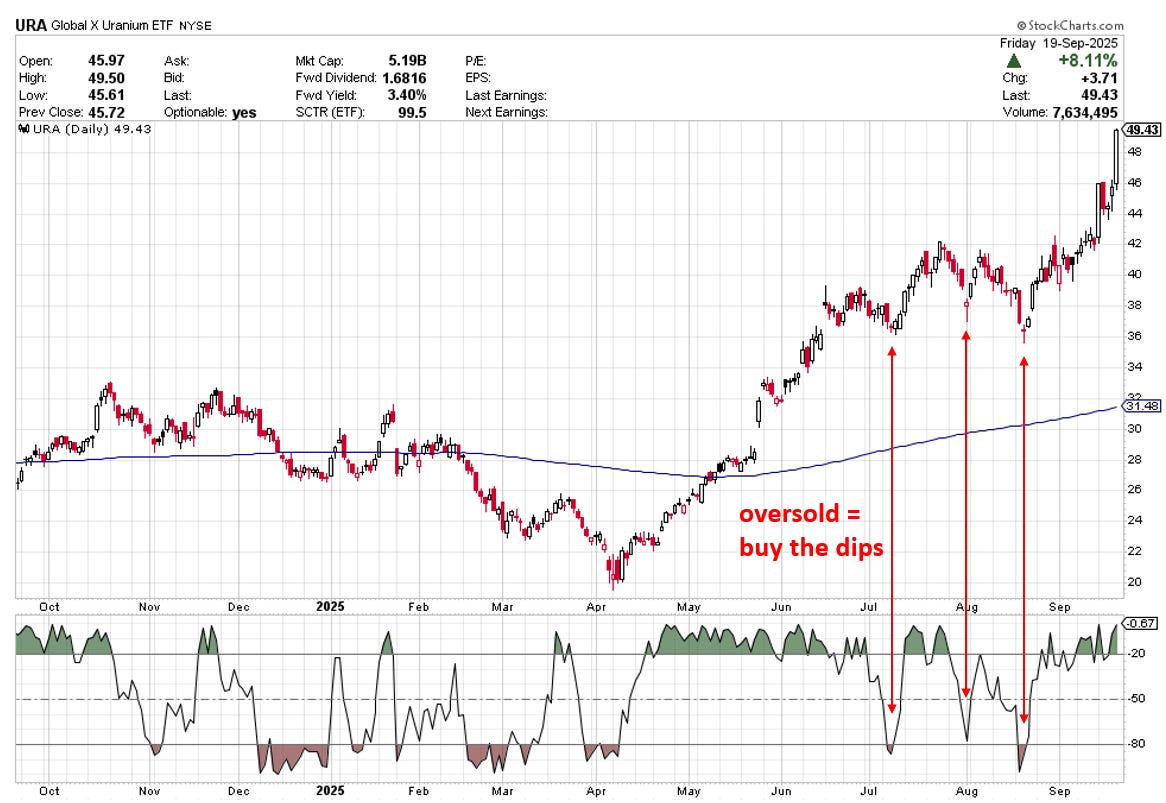
Next, let’s look at an example outside of precious metals, since this method can be applied to all kinds of assets and markets. This one is the widely followed URA uranium ETF, which has been on a strong run lately. It entered a confirmed uptrend in June, as indicated by the upward slope of the 200-day moving average.
URA then dipped three times in July and August, with each dip triggering an oversold reading on the Williams %R, signaling opportunities to buy. Each instance was followed by a solid rebound, with the last dip marking the exact bottom before the recent 36% surge that is likely just getting started.
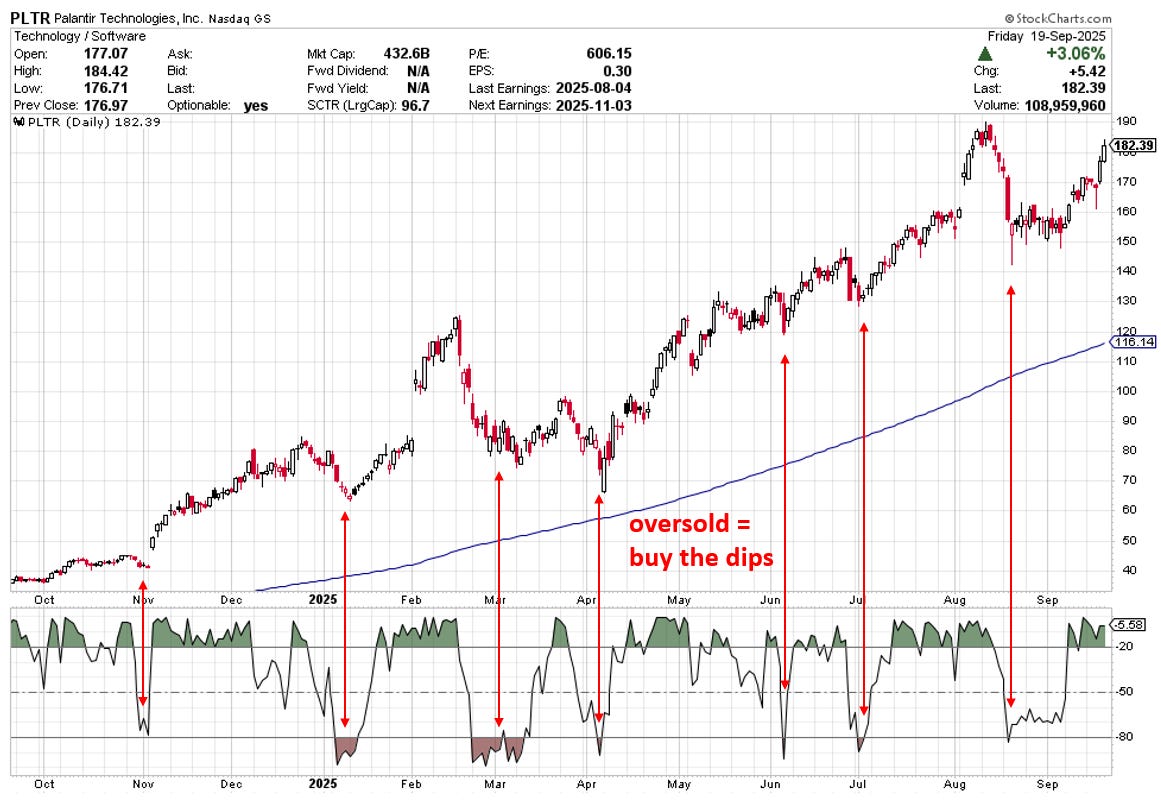
Next, let’s look at an example completely outside the realm of commodities—Palantir Technologies (PLTR), a heavily traded and closely watched software company. It has been in a strong confirmed uptrend for the past year, as indicated by the upward slope of the 200-day moving average. That signaled the need to watch for dip-buying opportunities based on oversold readings from the Williams %R indicator. Over that period, there were seven such signals, each marking a great opportunity to enter before the stock moved higher.
Also note that while the stock frequently became overbought, as indicated by the green status of the Williams %R, it would have been a mistake to panic and sell for that reason alone. This is exactly why I keep emphasizing not to worry about overbought readings in precious metals right now, because they remain in strong confirmed uptrends.
So far we’ve looked at several buy-the-dip examples, but now I want to shift to the opposite scenario: “sell the rip” (or bounce) opportunities. In this case, we look to see whether the asset is in a confirmed downtrend, which is indicated by a downward-sloping 200-day moving average.
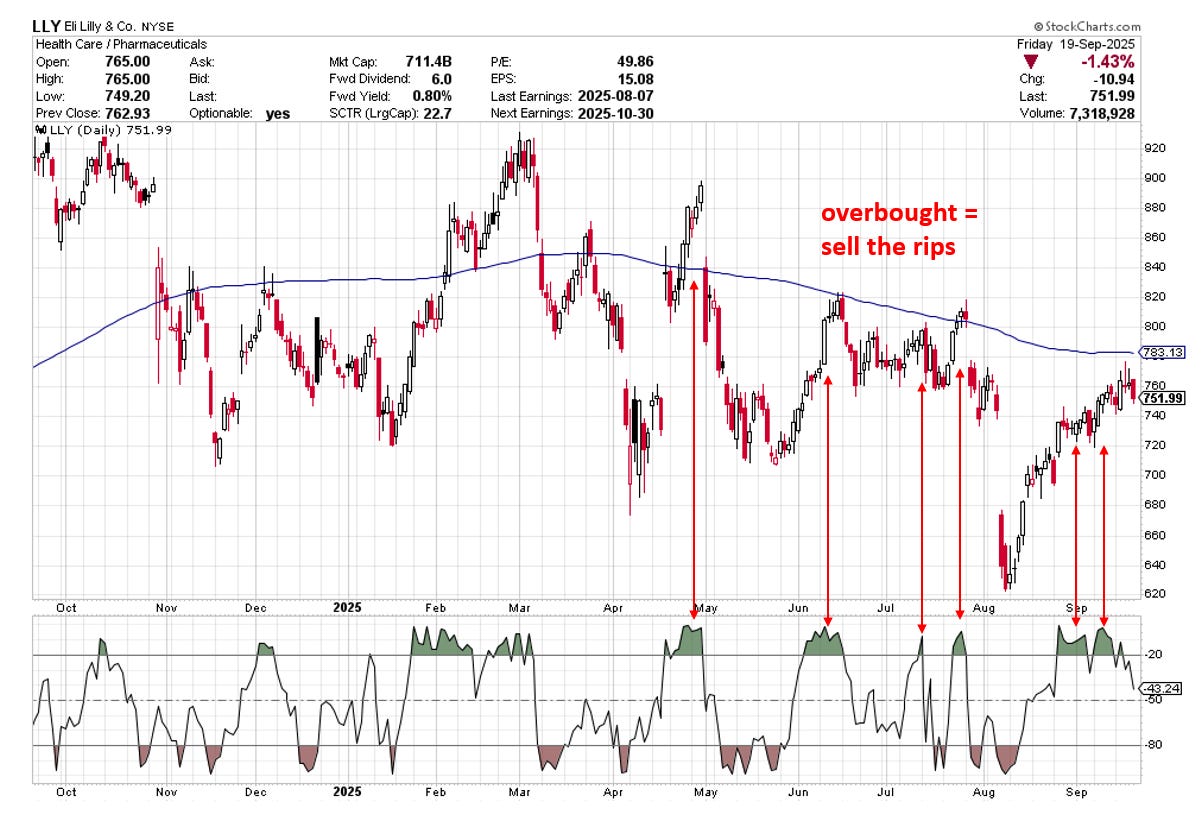
In this example, Eli Lilly (LLY) entered a confirmed downtrend in April. Since then, there have been six overbought readings on the Williams %R, each signaling a time to sell the rips. Many of these signals marked the peaks before sharp declines.
Also note that these were moments when many novice investors were getting excited about a possible rebound, unaware that the stock was still in a confirmed downtrend. As a result, they were caught in what are known as bull traps. Now that you understand this method, you can avoid getting caught in those capital-destroying situations.
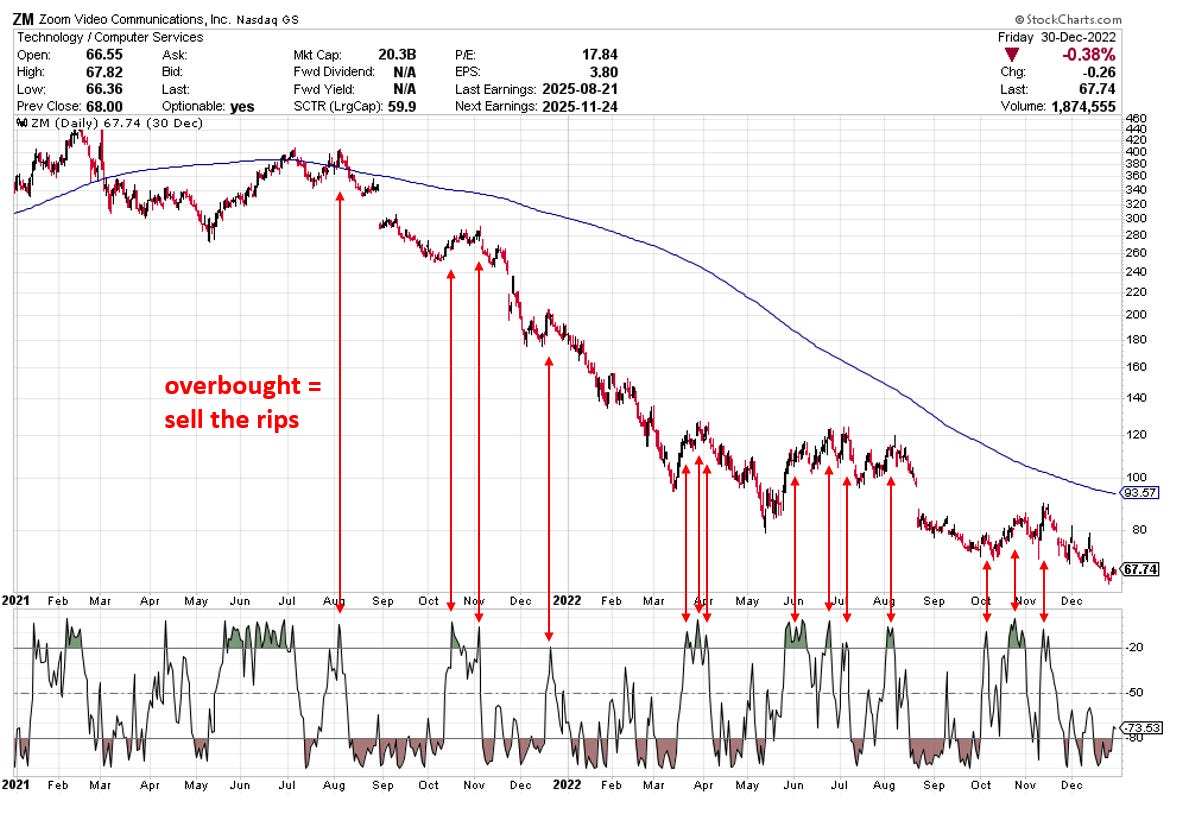
The next “sell the rips” example is a fascinating and cautionary one: Zoom Video Communications. The stock surged during the 2020 pandemic as millions of people began working from home. However, once the pandemic subsided and people started returning to the office in 2021, the stock collapsed—falling from around $460 to just $68 in the span of two years.
The signal that the stock was entering a downtrend came from the 200-day moving average, which began sloping downward in July 2021. That indicated that rips, or overbought conditions according to the Williams %R, should be sold—or even shorted for those inclined to do so. There were fourteen such sell opportunities during the entire decline, many of which marked key peaks before sharp drops. This example shows how effectively the technique worked during the stock’s dramatic fall from its highs.
Wrapping up, I hope I have made a strong case for the importance of identifying the predominant trend and trading in alignment with it rather than fighting it. Determining the trend is not guesswork; it is clear and straightforward when you use the slope of the 200-day moving average.
I also explained why it is important to view overbought and oversold readings in the proper context of the trend and not treat them as one-size-fits-all signals. Misreading these conditions can lead to costly mistakes, such as selling strong assets too early or trying to catch a falling knife in a weak market, only to watch it drop even further. I hope this method helps you in your own trading, improves your market analysis, and deepens your understanding of the content I publish in The Bubble Bubble Report.
If you’ve enjoyed this report or have any questions, comments, or thoughts, please give this post a like and share your thoughts in the comments below—I’d love to start a conversation and hear your perspective.